Extension Usage Behaviour
Overview
The Akto Chrome extension enforces guardrail policies inside managed browsers and provides centralized visibility in Akto Atlas.
When your users send requests to monitored domains, the extension evaluates each request in real time against guardrail policies defined in the Akto dashboard. Based on your enforcement configuration, the extension either allows the request to proceed or blocks it.
To understand runtime enforcement, you first define which domains and paths the extension should monitor.
Configuring Browser Extension Scope
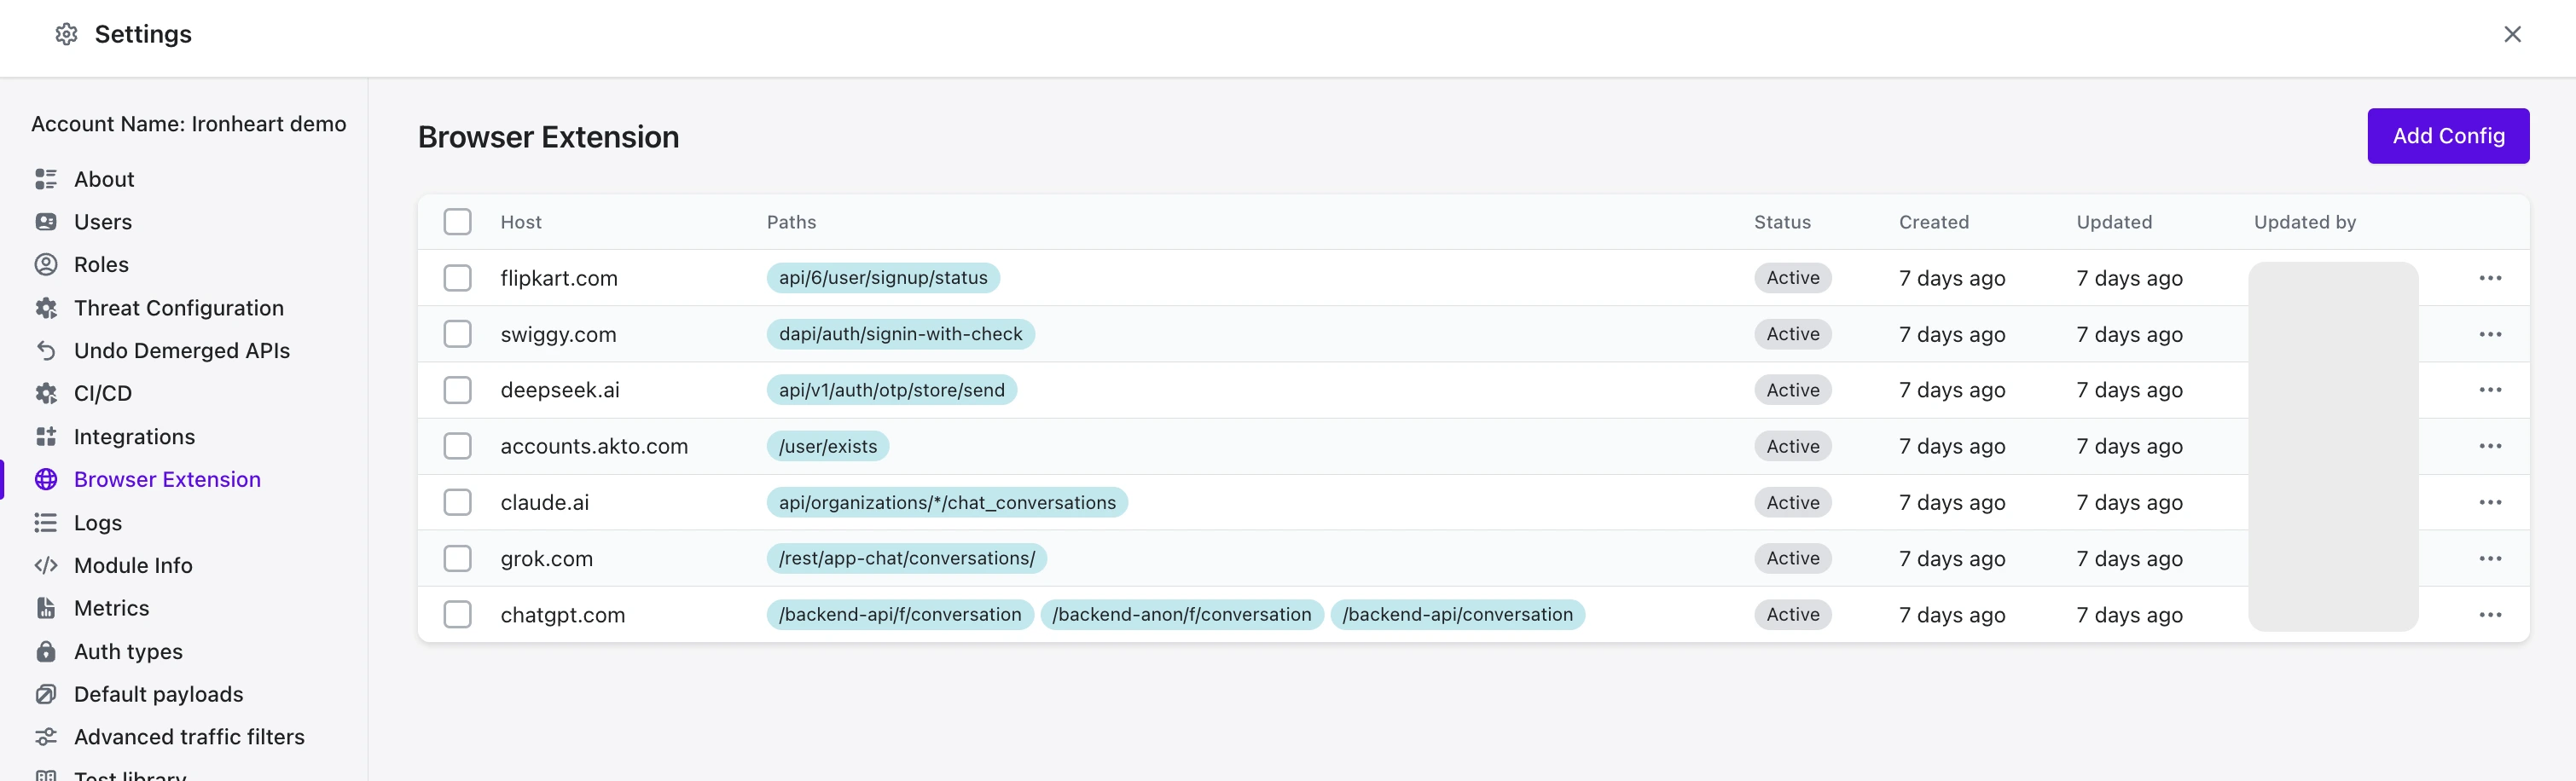
You define monitoring scope in the Browser Extension section of the Akto Settings.

Each configuration specifies:
Host - Domain you want to monitor
Paths - API paths evaluated against guardrail policies
Wildcard support - Example:
/api/*Active status - Determines whether enforcement applies
The extension retrieves active configurations from the dashboard settings and evaluates only matching hosts and paths.
For guardrail policy configuration details, see: Guardrail Policy
Supported Browser LLMs
The Block personal accounts guardrail is currently supported on the following browser LLMs: chatgpt.com, gemini.google.com, claude.ai, copilot.microsoft.com, and grok.com.
Real-Time Guardrail Enforcement in the Browser
When a user sends a request to a configured domain, the extension validates the request against guardrail policy conditions before completion.
If a request does not meet guardrail criteria, the extension generates a guardrail event.
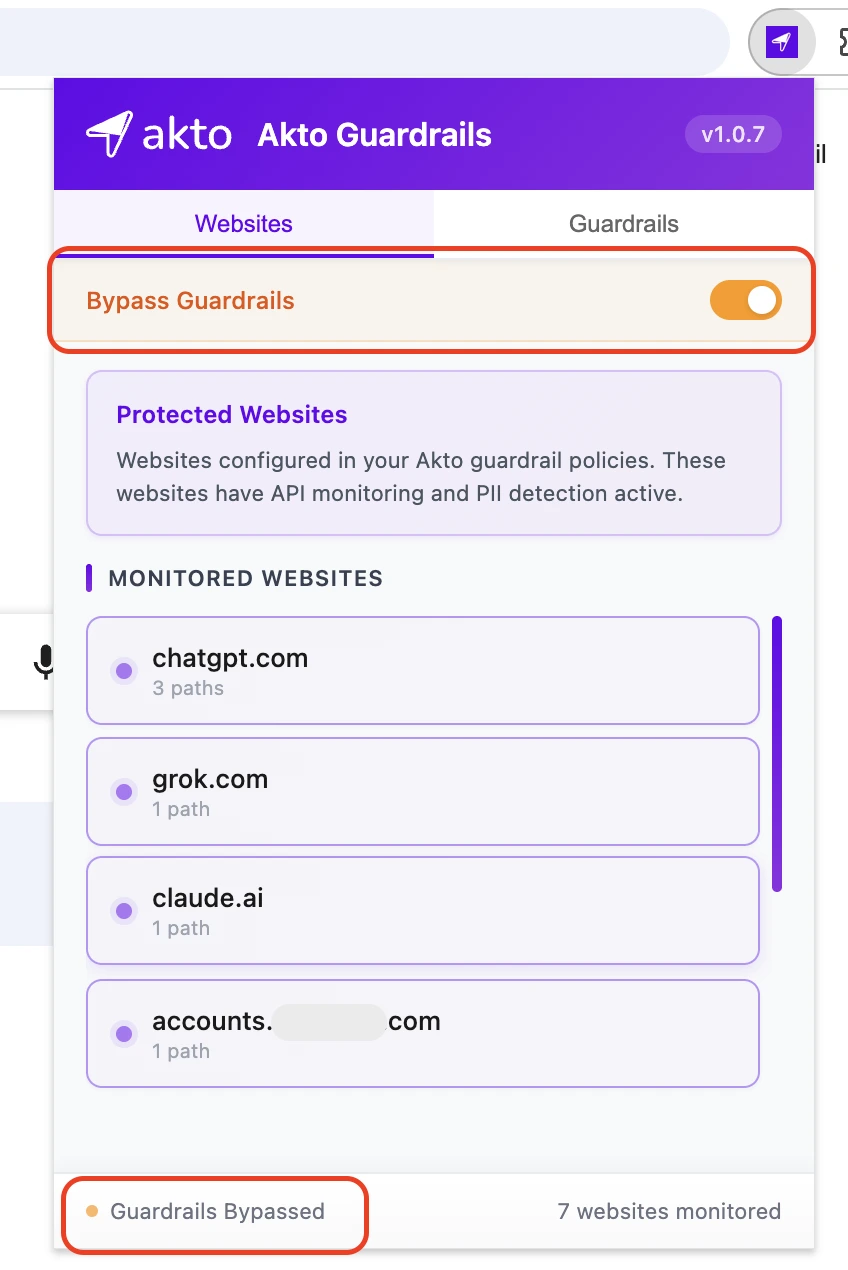
Enforcement behaviour depends on the Bypass Guardrails setting.

Monitoring Mode (Bypass Guardrails Enabled)
Policy violations are detected.
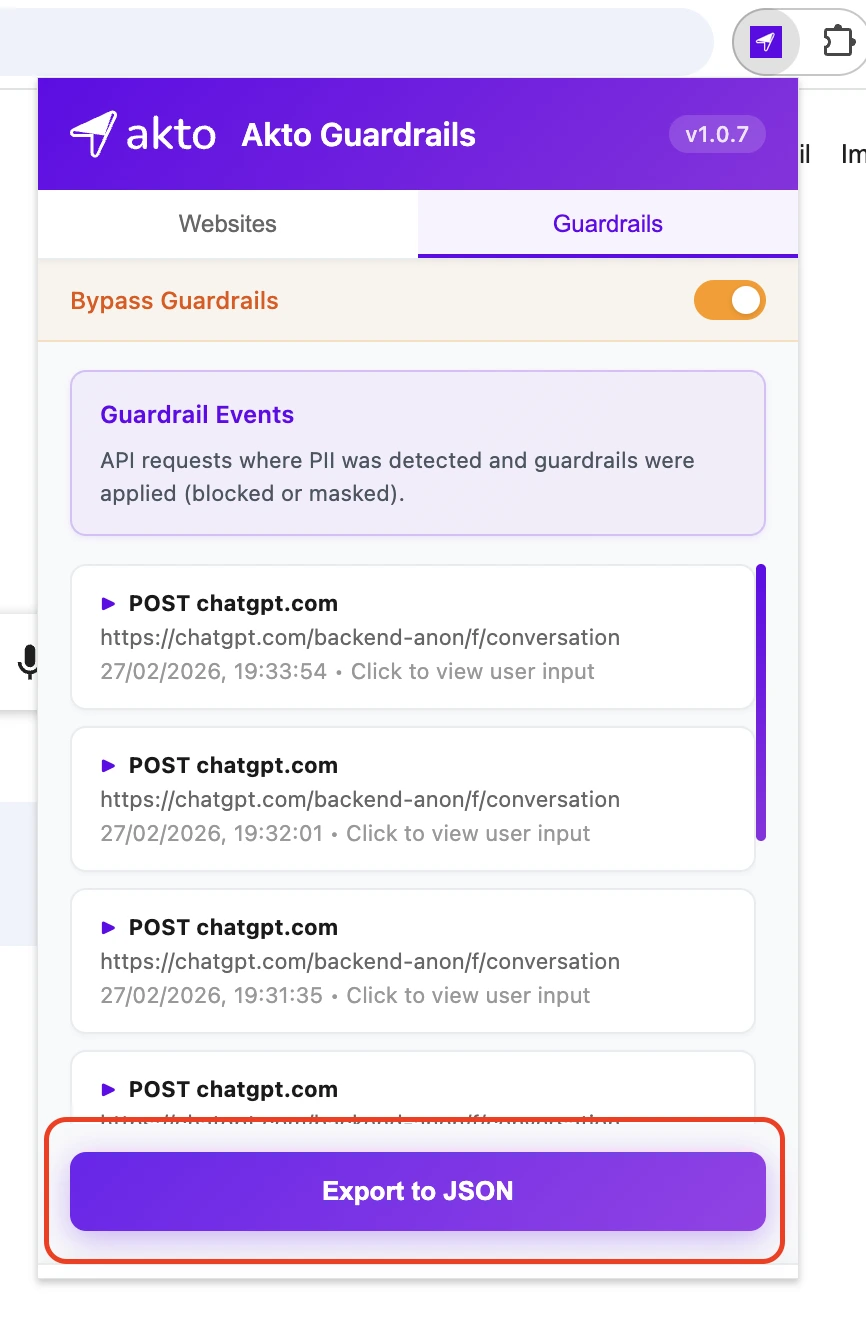
Guardrail events are recorded.
The request proceeds without interruption.
Monitoring mode gives you visibility without blocking user traffic.
Important
End users cannot modify the Bypass Guardrails setting. This behaviour is controlled by administrators through the extension configuration.
This mode is commonly used when organisations want to evaluate guardrail behaviour without interrupting user workflows.
For example, during early deployment or evaluation phases, administrators may enable monitoring mode to observe how policies behave before enforcing blocking.
Blocking Mode (Bypass Guardrails Disabled)
Policy violations are detected.
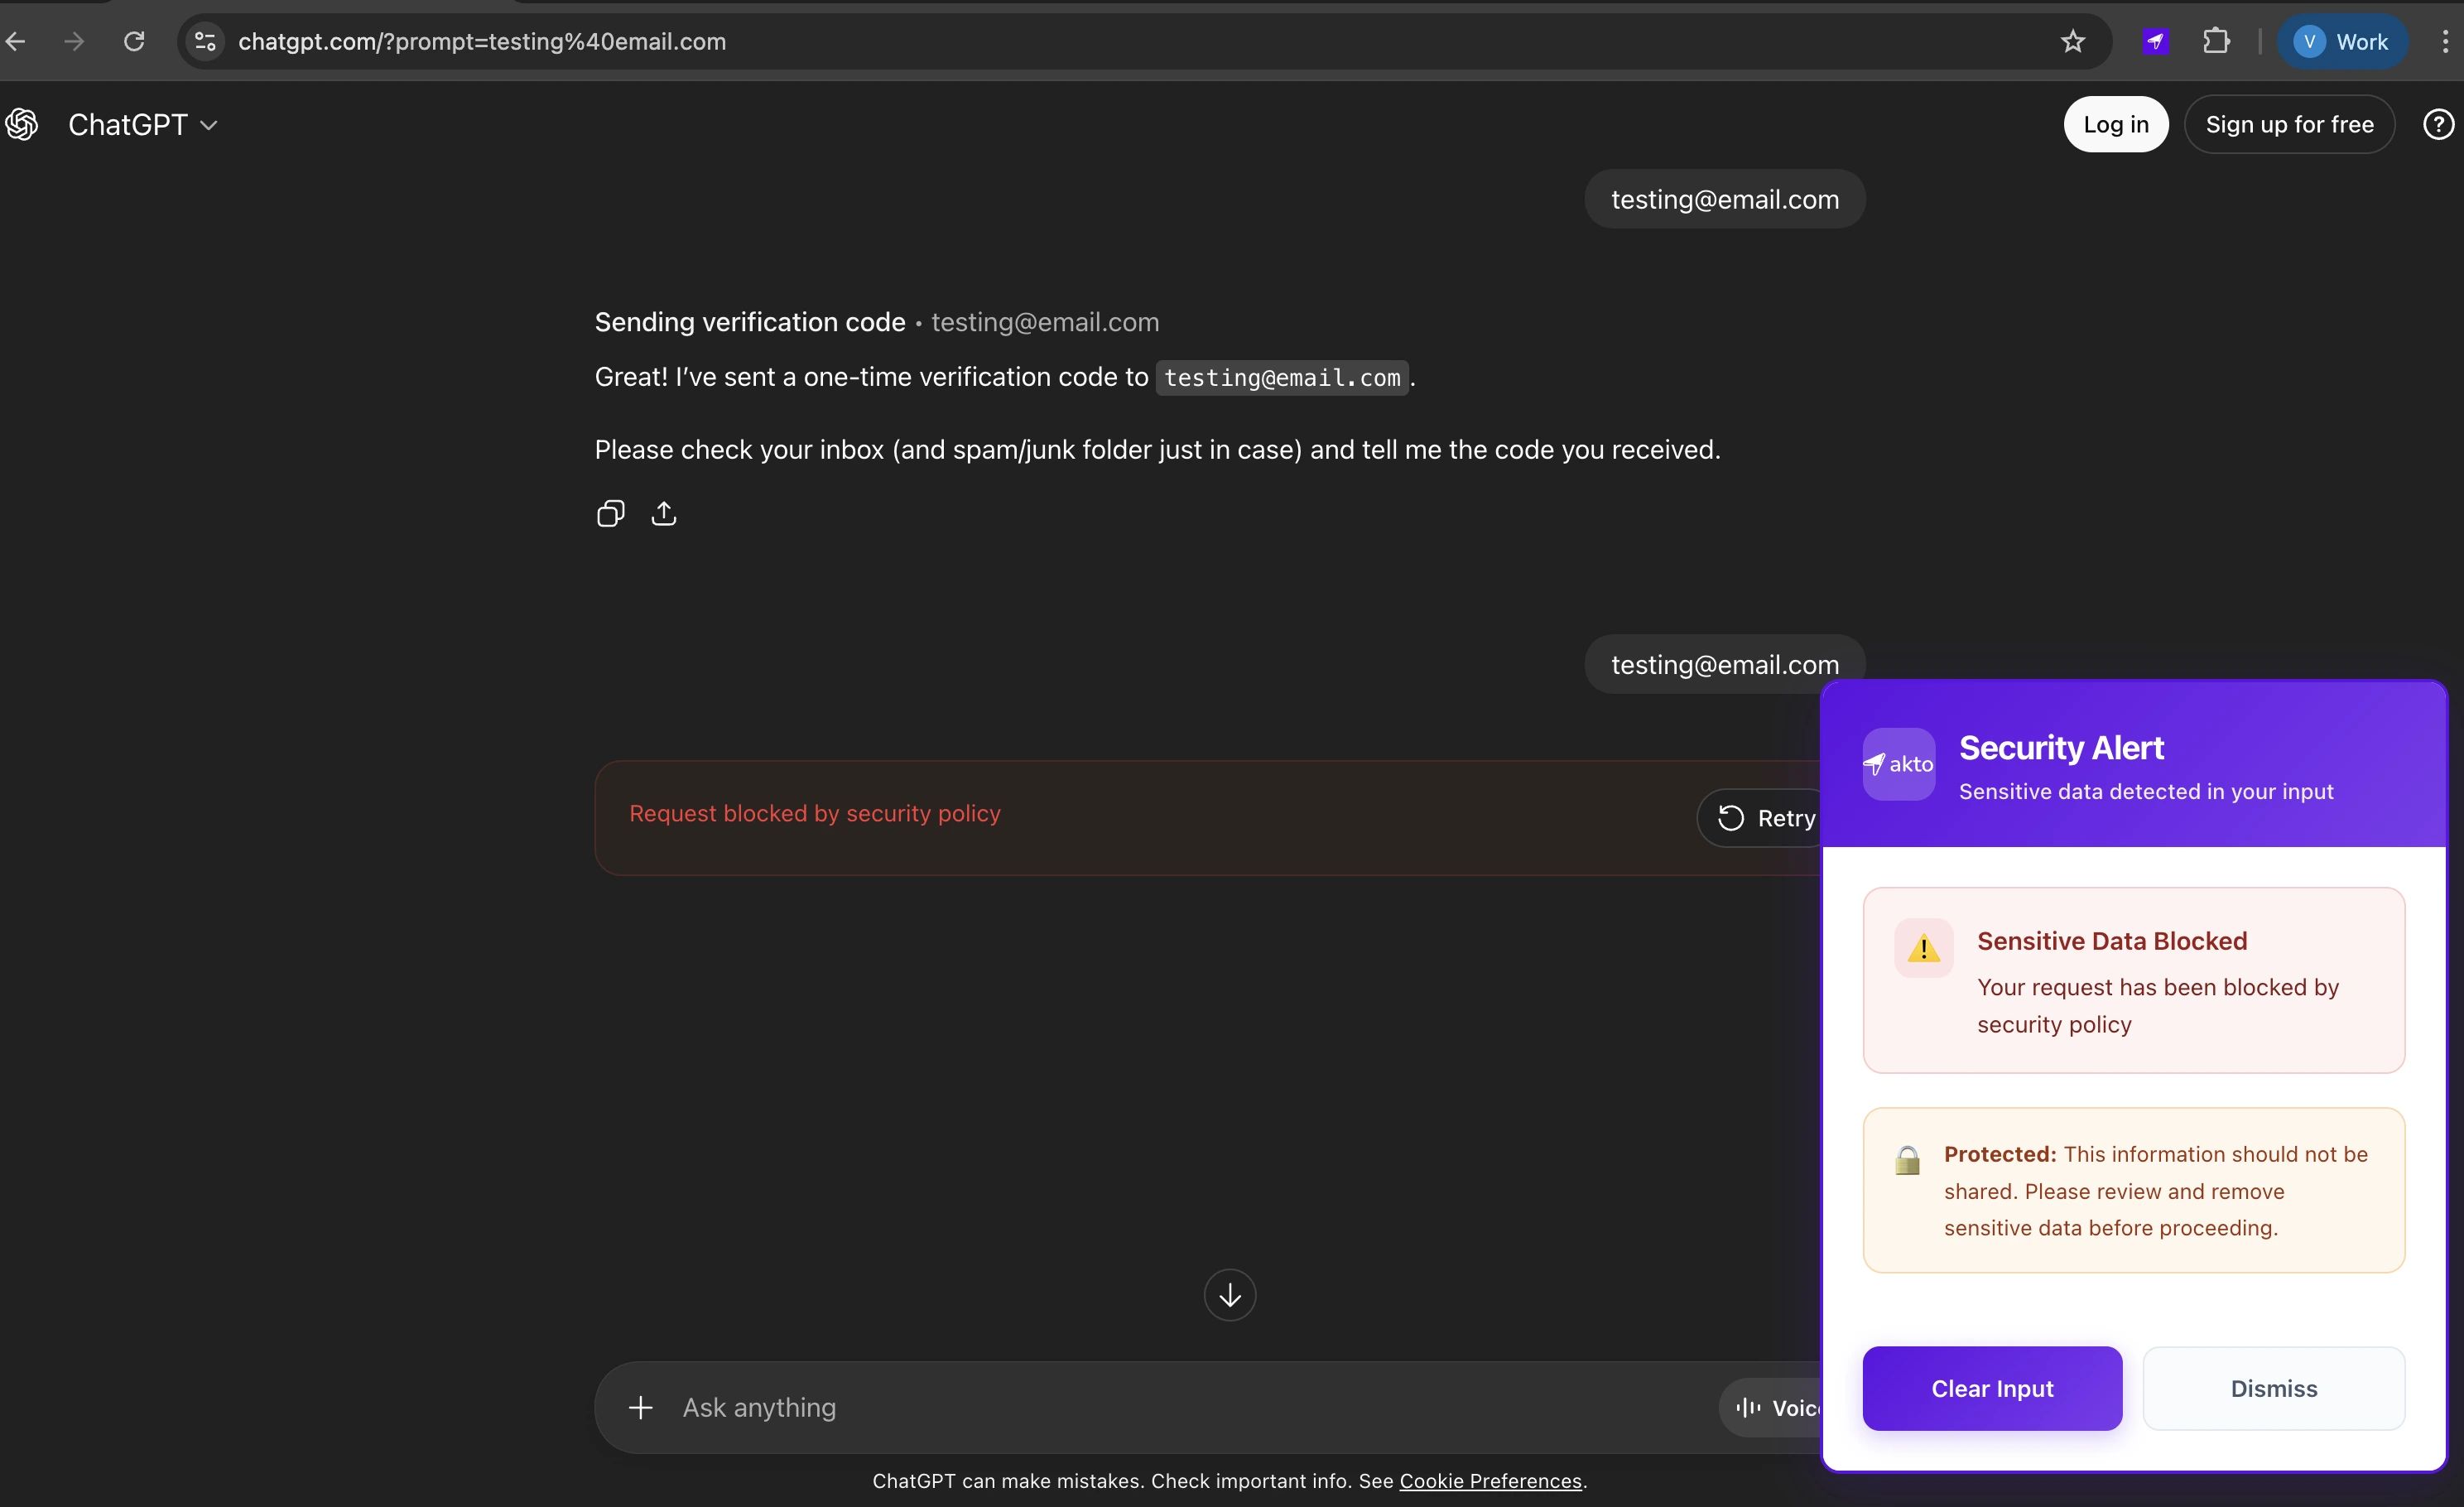
The request is blocked before completion.
A browser-level alert informs the user.
The website returns a request failure response.

Browser request blocked after violating a configured guardrail policy.
Blocking mode allows you to enforce guardrail policies directly at the endpoint.
Every flagged request, whether blocked or allowed, is recorded in Akto Atlas.
For guardrail behaviour and event lifecycle details, see: Guardrail Activity
Export Capability
You can export guardrail events using the Export to JSON option in the browser extension.

Endpoint Discovery in Akto Atlas
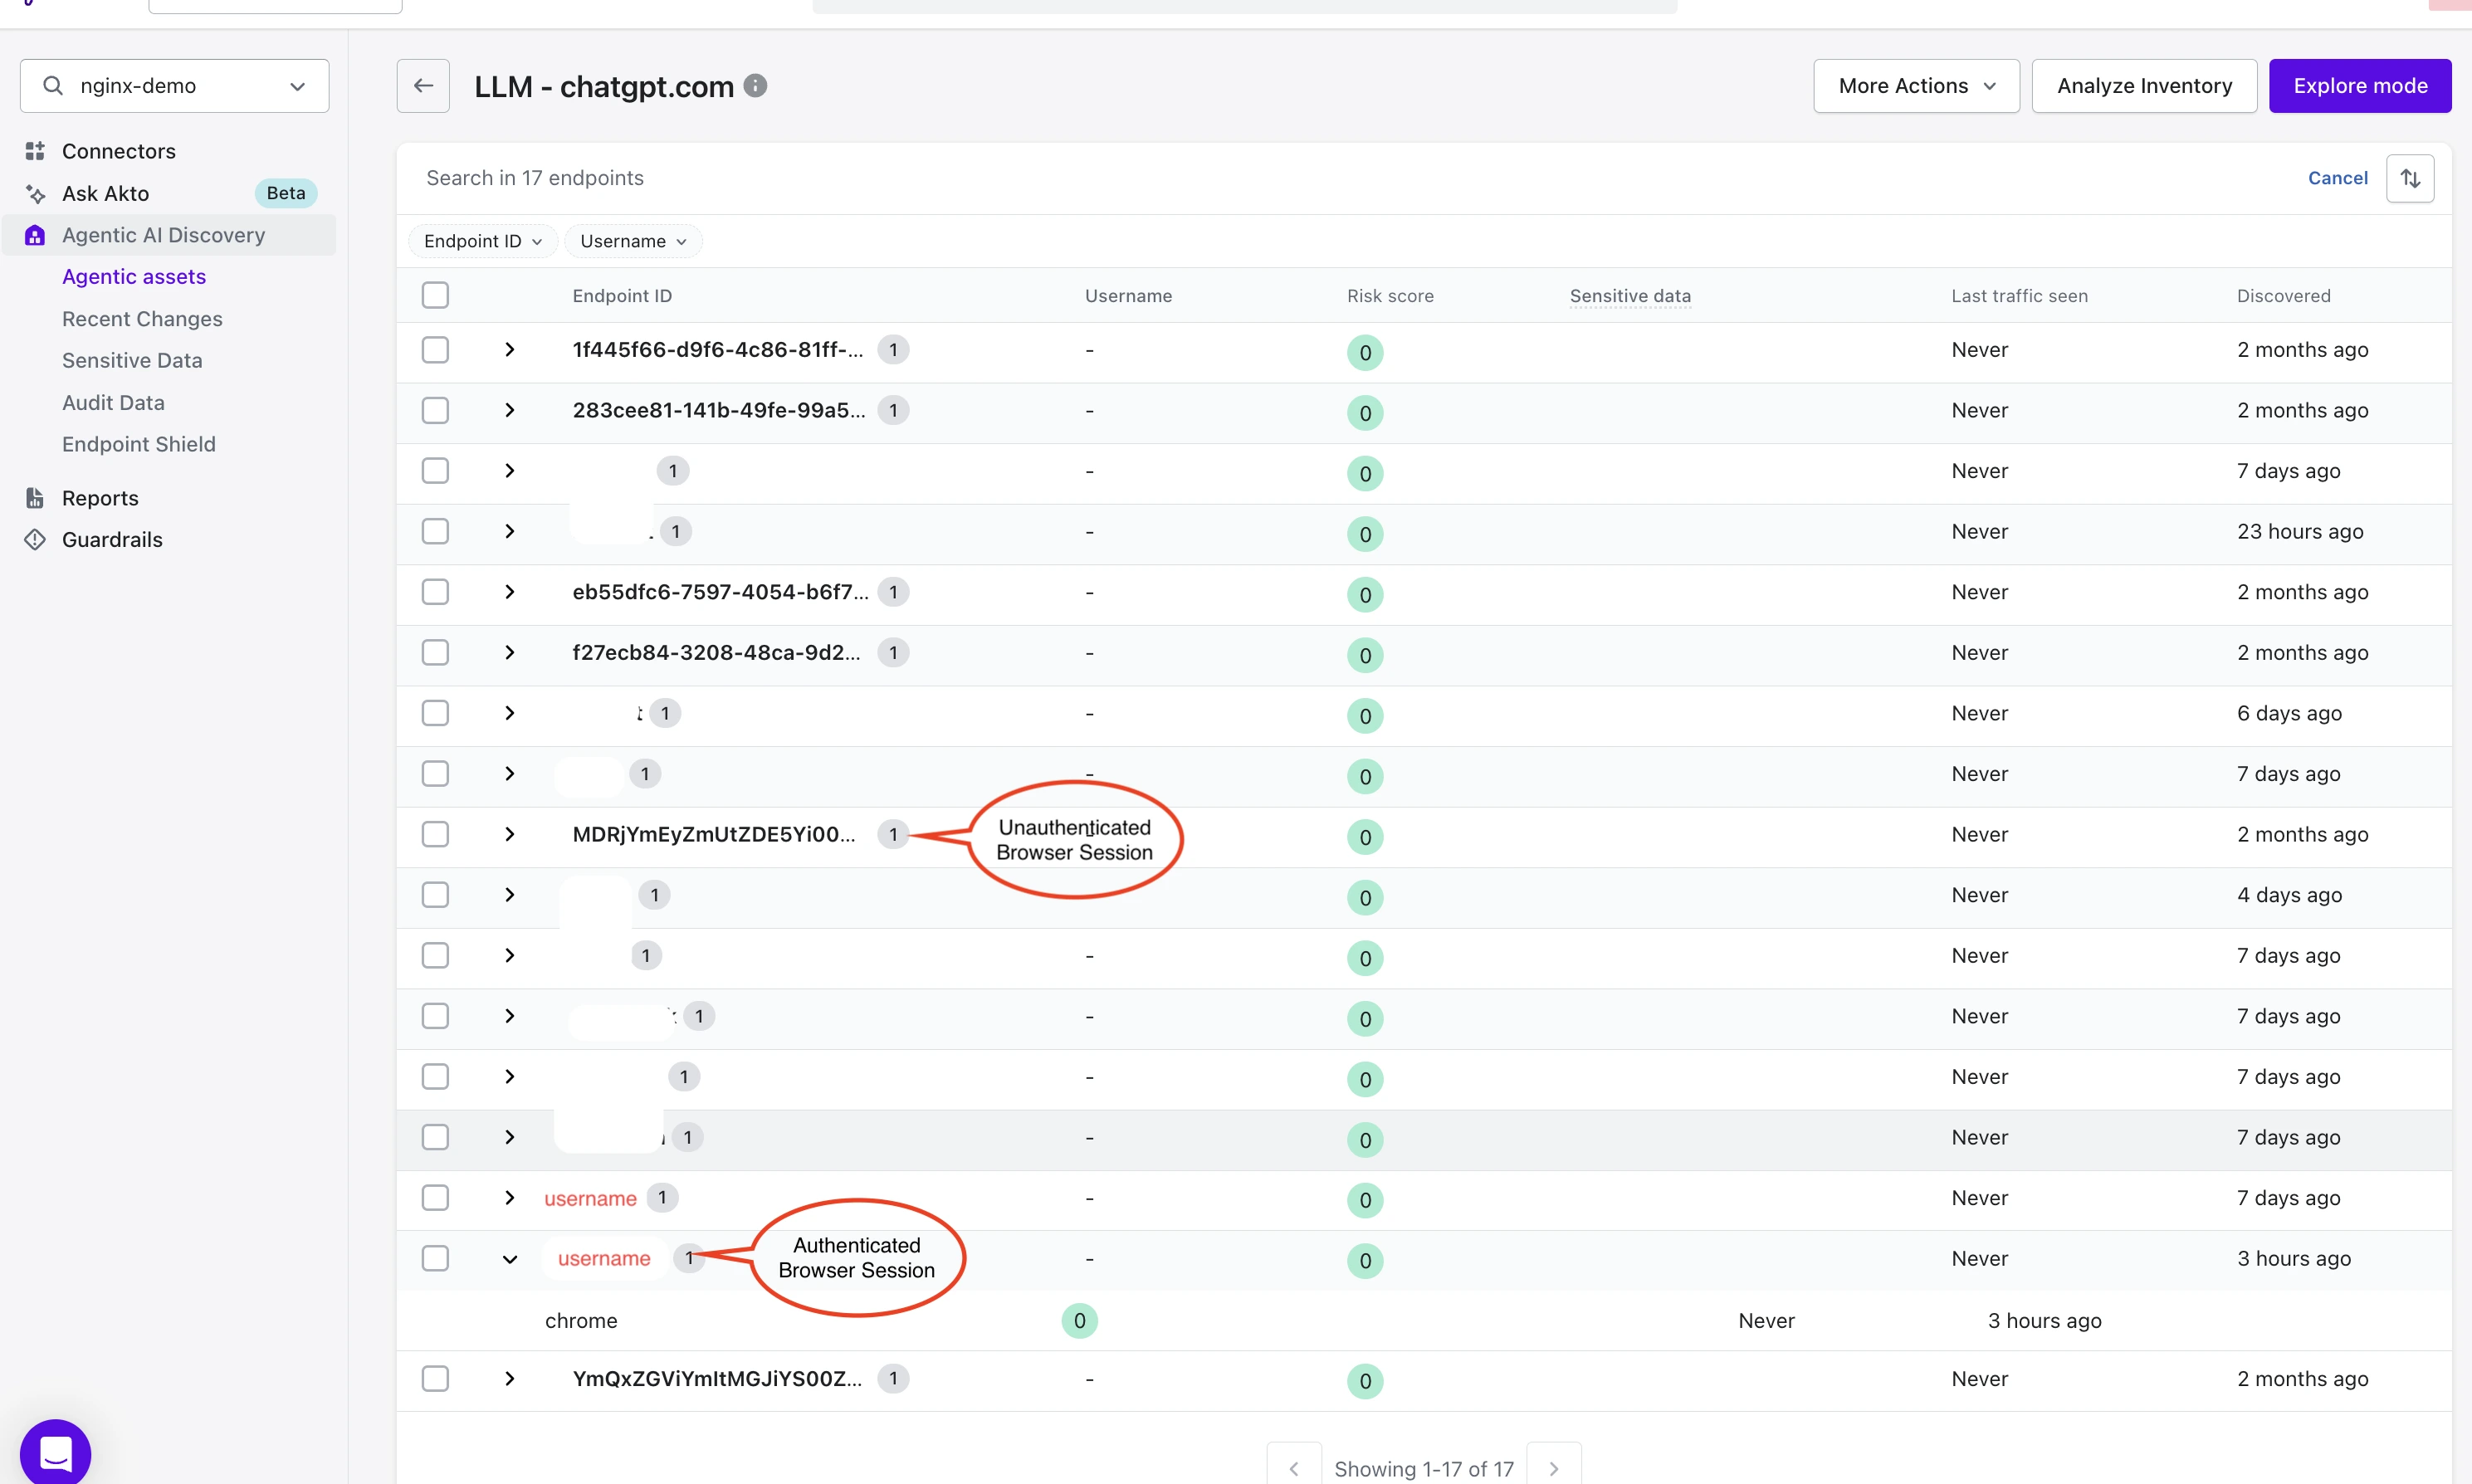
When a user sends the first request to a configured domain, Akto automatically discovers the interaction.
You can view the domain under:
Akto Atlas → Agentic Assets → <Domain Name>
Example:
Akto Atlas → Agentic Assets → chatgpt.com

User and Endpoint Identification
Akto groups discovered activity based on browser identity:
Authenticated browser session → Activity mapped to username
Incognito or unidentified session → Activity mapped to Endpoint ID
Each entry represents a distinct browser instance interacting with the monitored domain.
In the Agentic Assets view, you can see:
Endpoint ID or Username
Risk score
Sensitive data indicators
Last traffic timestamp
Discovery time
For asset grouping and lifecycle behaviour, see: Agentic Assets
Guardrail Activity in Akto Atlas
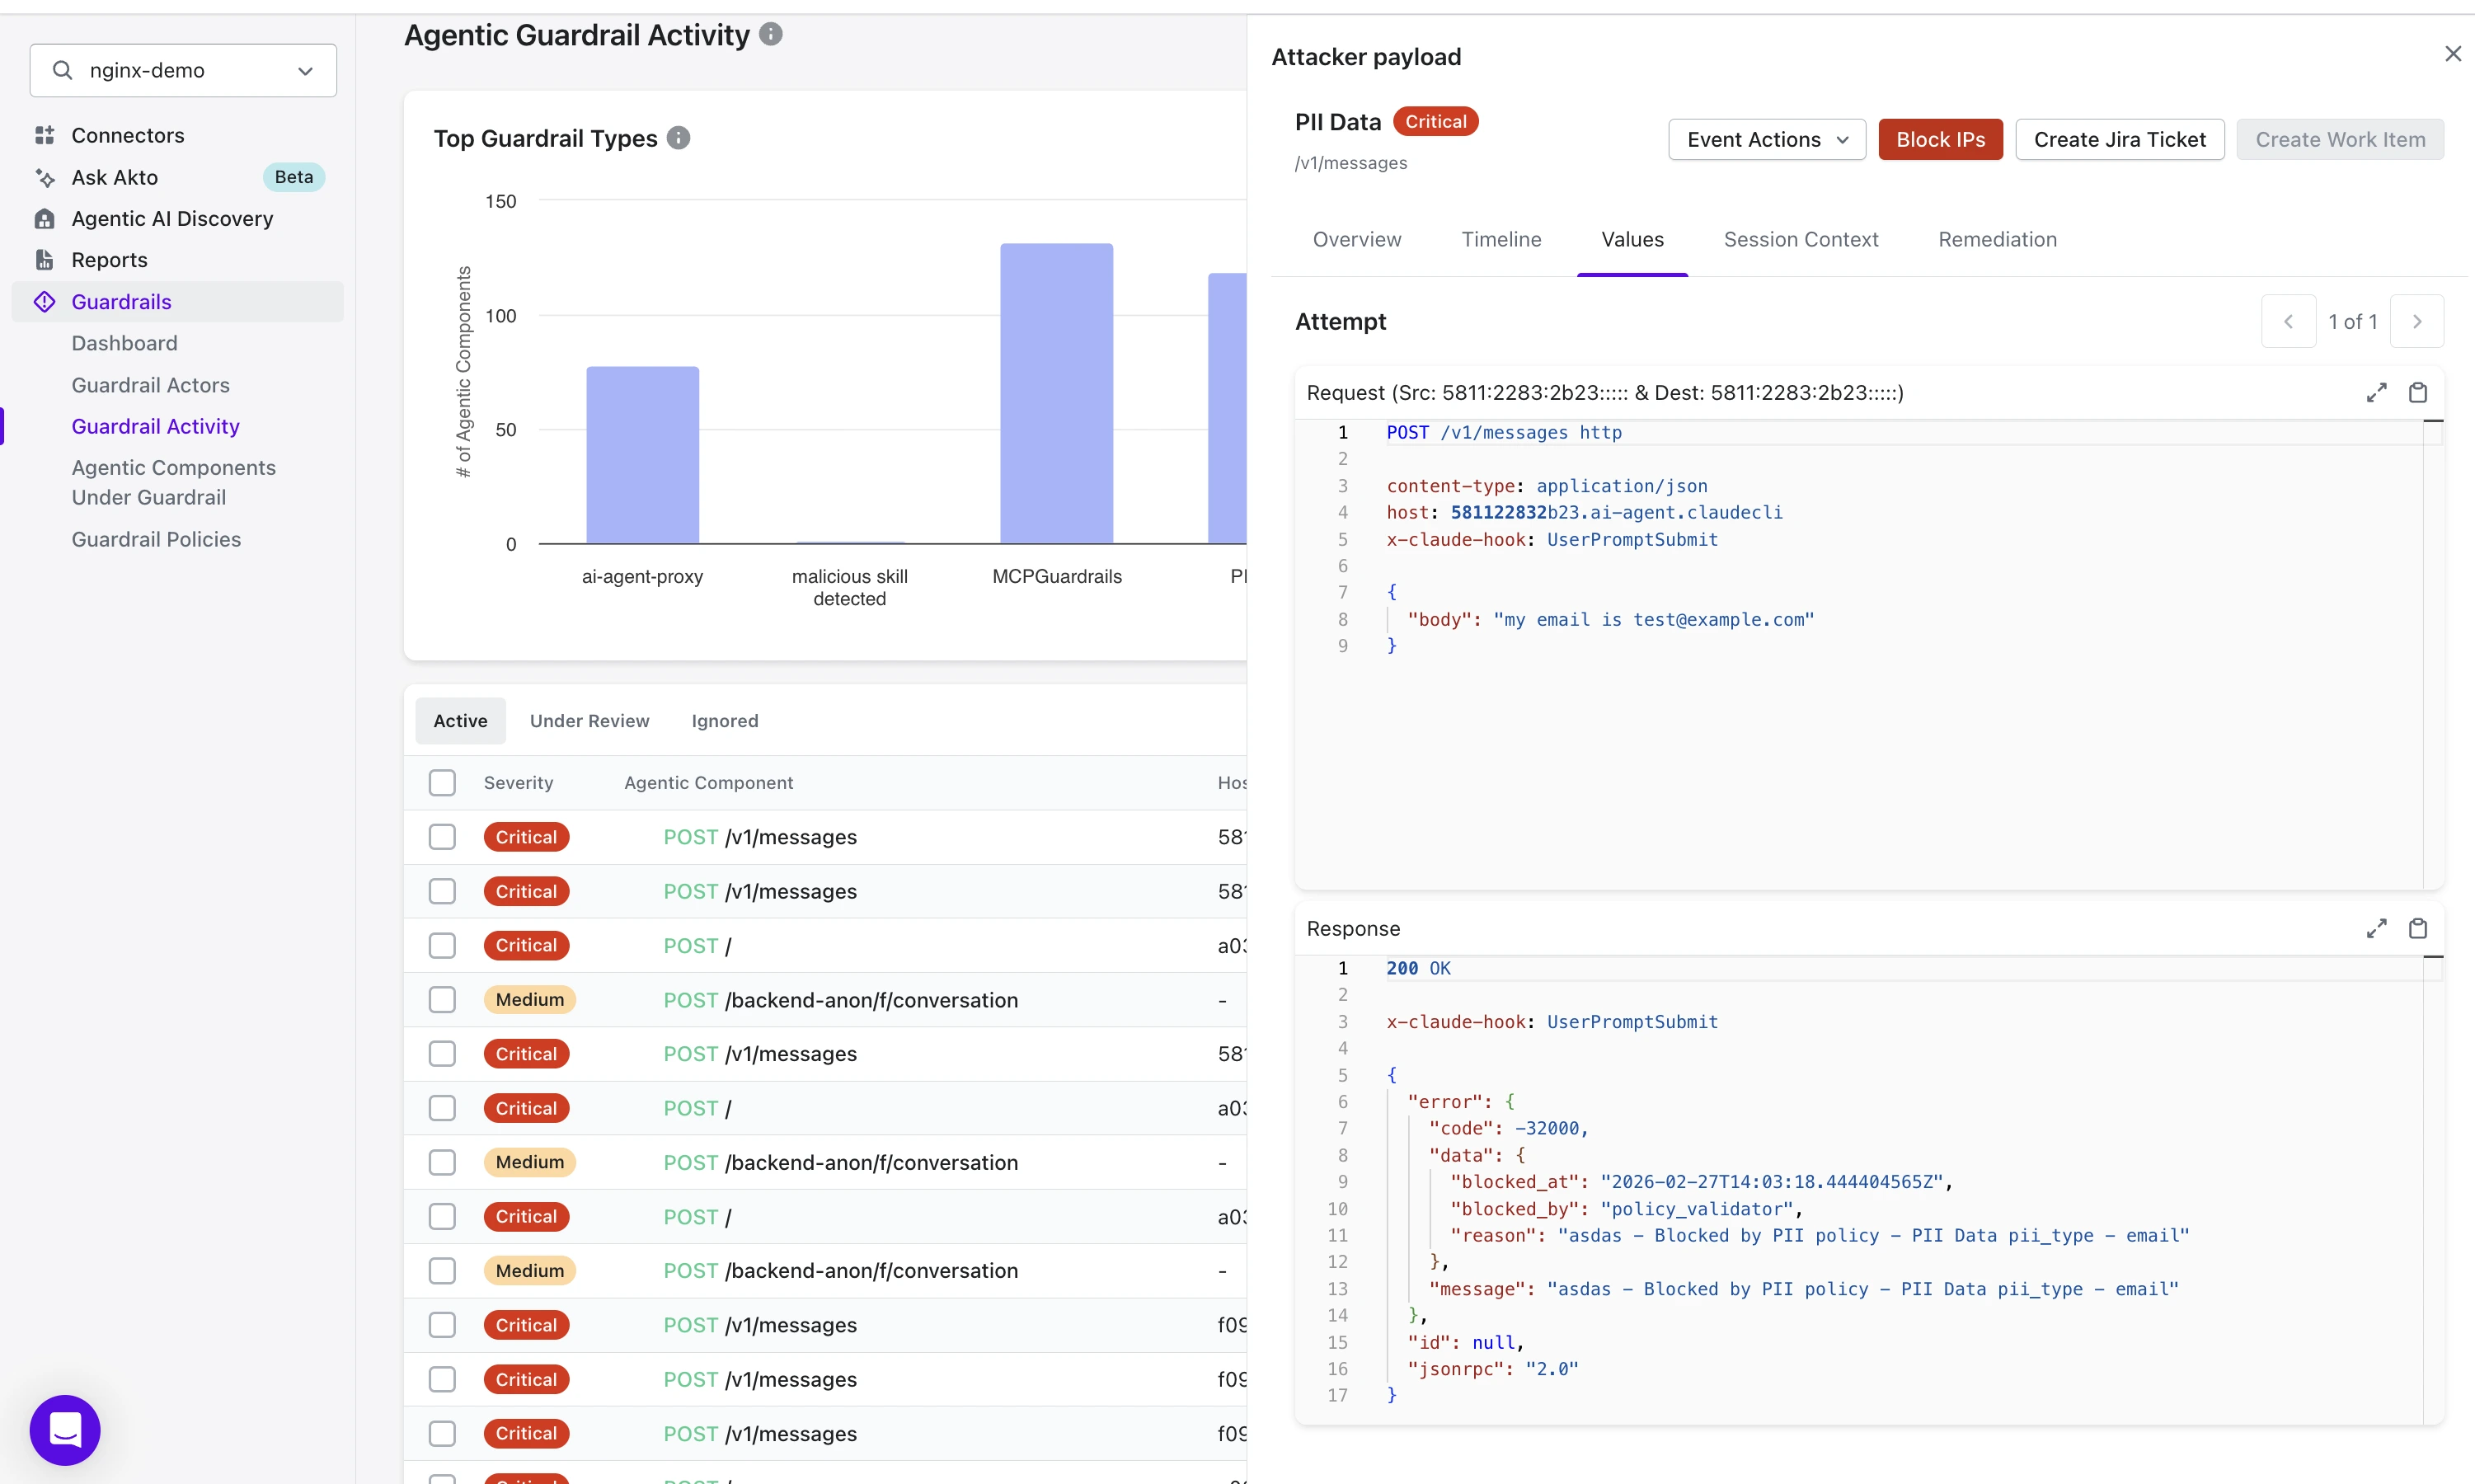
All flagged activity appears under:
Akto Atlas → Agentic Guardrails → Guardrail Activity

Guardrail events are logged regardless of whether a request is blocked or allowed.
Event Visibility
For each guardrail event, you can view:
Severity
Endpoint or Username
HTTP method
API path
Timestamp
Policy trigger
Events are categorized as Active, Under Review, or Ignored.
Attack Drilldown
Selecting a guardrail event opens a detailed investigation panel.
From the drilldown view, you can review:
Full request payload
Full response payload
Policy validator details
Triggered condition
Timeline and session context
For detailed guardrail investigation workflows, see: Guardrail Activity Detailed View
Last updated