> For the complete documentation index, see [llms.txt](https://ai-security-docs.akto.io/llms.txt). Markdown versions of documentation pages are available by appending `.md` to page URLs; this page is available as [Markdown](https://ai-security-docs.akto.io/akto-atlas-agentic-ai-security-for-employee-endpoints/ai-agent-activity/traces.md).

# Traces

## Overview

The **Traces** page gives you visibility into every AI/LLM session initiated by users and agentic applications across your organization. It shows who is prompting which models, how much they're consuming, and lets you drill into individual sessions to see what was actually asked.

From here, you can:

* Track overall session and token volume across your organization
* See which users and models are driving the most usage
* Search and inspect individual sessions, including the topics queried and tokens consumed

Navigate to: **Akto Atlas → Agentic AI Discovery → Traces**

## Summary Cards

The top of the page gives you an at-a-glance view of activity over the selected time range (default: **All time**, adjustable from the top-right filter).

<table><thead><tr><th width="180">Card</th><th>What it tells you</th></tr></thead><tbody><tr><td><strong>Total sessions</strong></td><td>The total number of traced sessions, broken down by top contributing users</td></tr><tr><td><strong>Total tokens</strong></td><td>The total tokens consumed across all sessions, split into <strong>In</strong> (prompt) and <strong>Out</strong> (completion) tokens</td></tr><tr><td><strong>Top Users by tokens</strong></td><td>The users consuming the most tokens, ranked highest to lowest</td></tr><tr><td><strong>Top Models by sessions</strong></td><td>The LLMs seen most often, ranked by number of sessions</td></tr></tbody></table>

{% hint style="info" %}
Use the **All time** dropdown in the top-right corner to narrow the summary cards and session list to a specific time window.
{% endhint %}

## Explore Sessions

Below the summary cards, the **Sessions** table lists every traced session, one row per session. Use the **Search sessions** bar to filter by keywords found in the session.

<table><thead><tr><th width="160">Column</th><th>What it tells you</th></tr></thead><tbody><tr><td><strong>Session</strong></td><td>A preview of the session's content, such as the initial prompt or payload</td></tr><tr><td><strong>User</strong></td><td>The user or service account that initiated the session</td></tr><tr><td><strong>Model</strong></td><td>The LLM used for the session, if identified</td></tr><tr><td><strong>Application</strong></td><td>The agentic application the session came through (e.g. <strong>claudecli</strong>, <strong>claude_cowork</strong>, <strong>kirocli</strong>)</td></tr><tr><td><strong>Traces</strong></td><td>The number of individual traces (requests) recorded within the session</td></tr><tr><td><strong>Topics Queried</strong></td><td>Topic tags automatically classified from the session's content (e.g. Technology, Security)</td></tr><tr><td><strong>Tokens in / out</strong></td><td>Prompt and completion tokens consumed by the session</td></tr><tr><td><strong>Duration</strong></td><td>How long the session lasted</td></tr></tbody></table>

Use the **Columns** panel to add or remove columns from the table, and the **Filters** panel to narrow the list down, for example, by **User**, **Model**, or **Application**.

{% hint style="info" %}
Click on a session row to open its full detail, including the complete list of traces recorded within it.
{% endhint %}

## Session Detail

Clicking a session row opens a side panel with two tabs:

{% tabs %}
{% tab title="Overview" %}
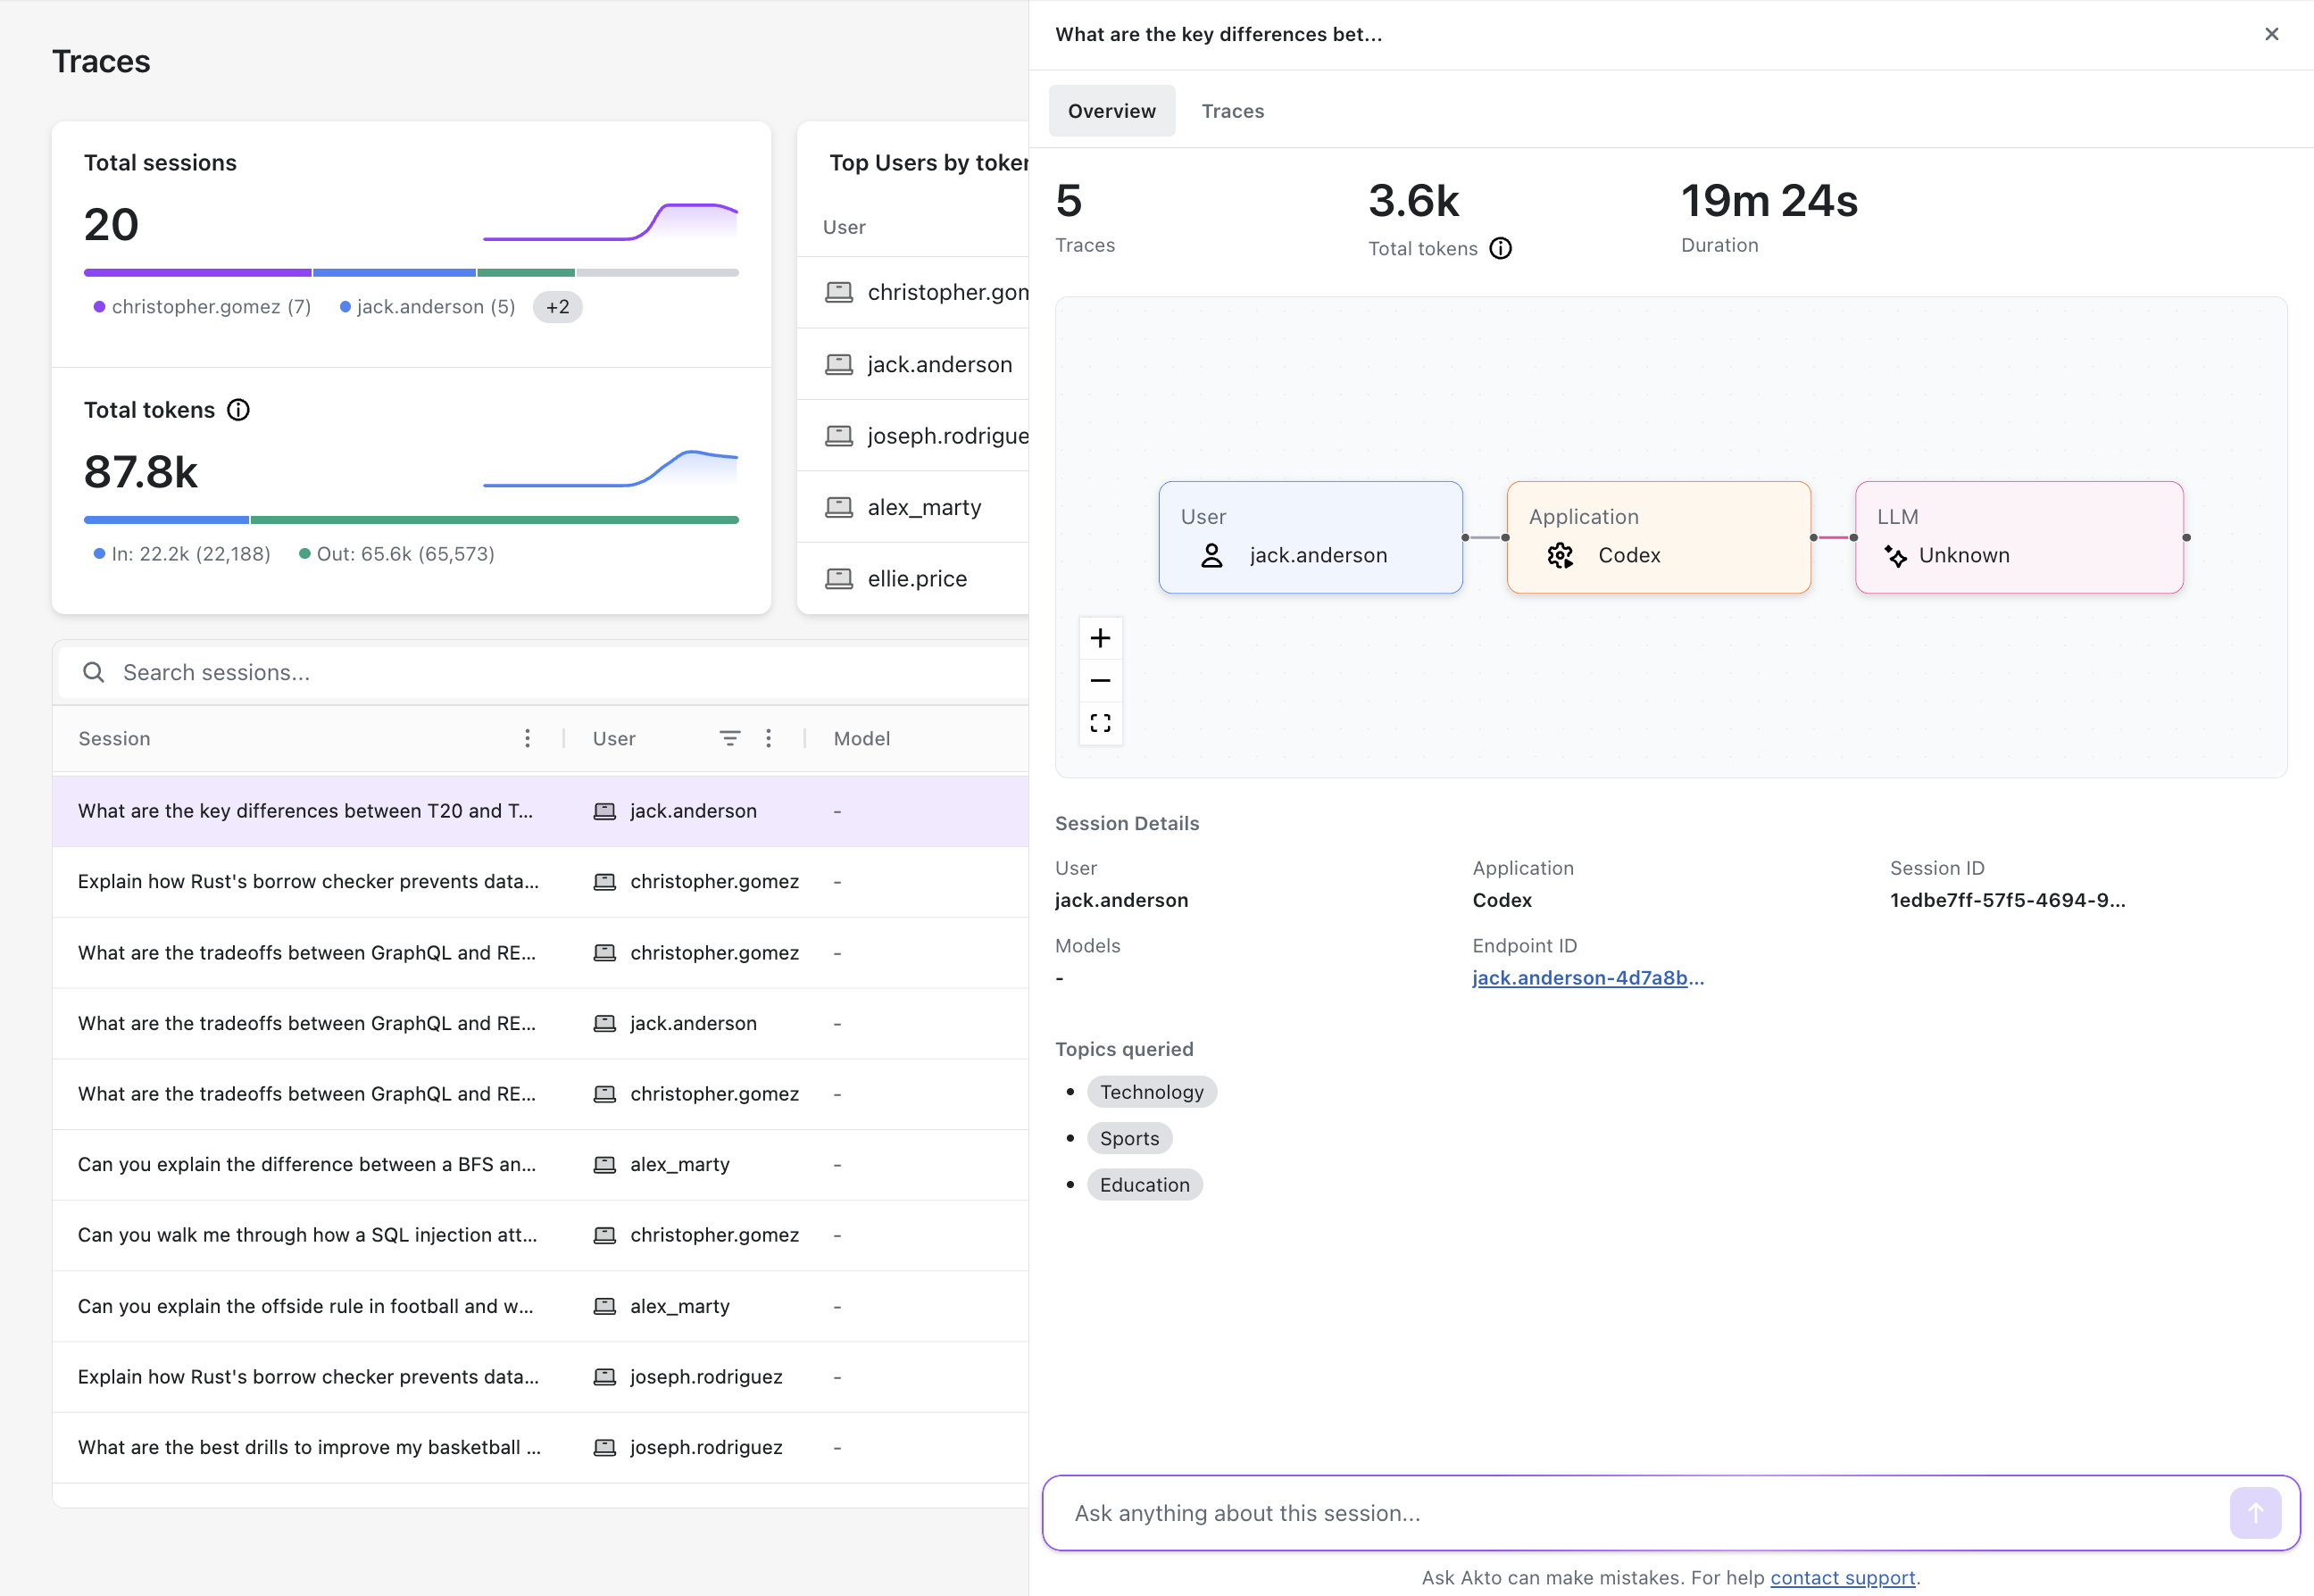
The Overview tab summarises the session and visualises the flow of the request.

<table><thead><tr><th width="160">Field</th><th>What it tells you</th></tr></thead><tbody><tr><td><strong>Traces</strong></td><td>The number of individual traces recorded in this session</td></tr><tr><td><strong>Total tokens</strong></td><td>The combined input and output tokens consumed across the session</td></tr><tr><td><strong>Duration</strong></td><td>How long the session ran for</td></tr></tbody></table>

Below the summary, a flow diagram shows how the request moved through your environment: **User → Application → LLM**. Each node identifies the specific user, application, and model involved (the LLM node shows **Unknown** if the model could not be identified). Use the **+**/**-** controls or the fullscreen icon to zoom and pan the diagram.

<div data-with-frame="true"><figure><img src="/files/Lj38YKfeOjdDSP2RRvX3" alt="" width="563"><figcaption></figcaption></figure></div>

The **Session Details** section lists:

<table><thead><tr><th width="160">Field</th><th>What it tells you</th></tr></thead><tbody><tr><td><strong>User</strong></td><td>The user who initiated the session</td></tr><tr><td><strong>Application</strong></td><td>The agentic application the session came through</td></tr><tr><td><strong>Session ID</strong></td><td>The unique identifier for the session</td></tr><tr><td><strong>Models</strong></td><td>The LLM(s) used in the session, if identified</td></tr><tr><td><strong>Endpoint ID</strong></td><td>A link to the endpoint (device) the session originated from</td></tr><tr><td><strong>Topics queried</strong></td><td>Topic tags automatically classified from the session's content</td></tr></tbody></table>

{% hint style="info" %}
Use the **Ask anything about this session...** box at the bottom of the panel to ask Akto questions about the session directly.
{% endhint %}
{% endtab %}

{% tab title="Traces" %}
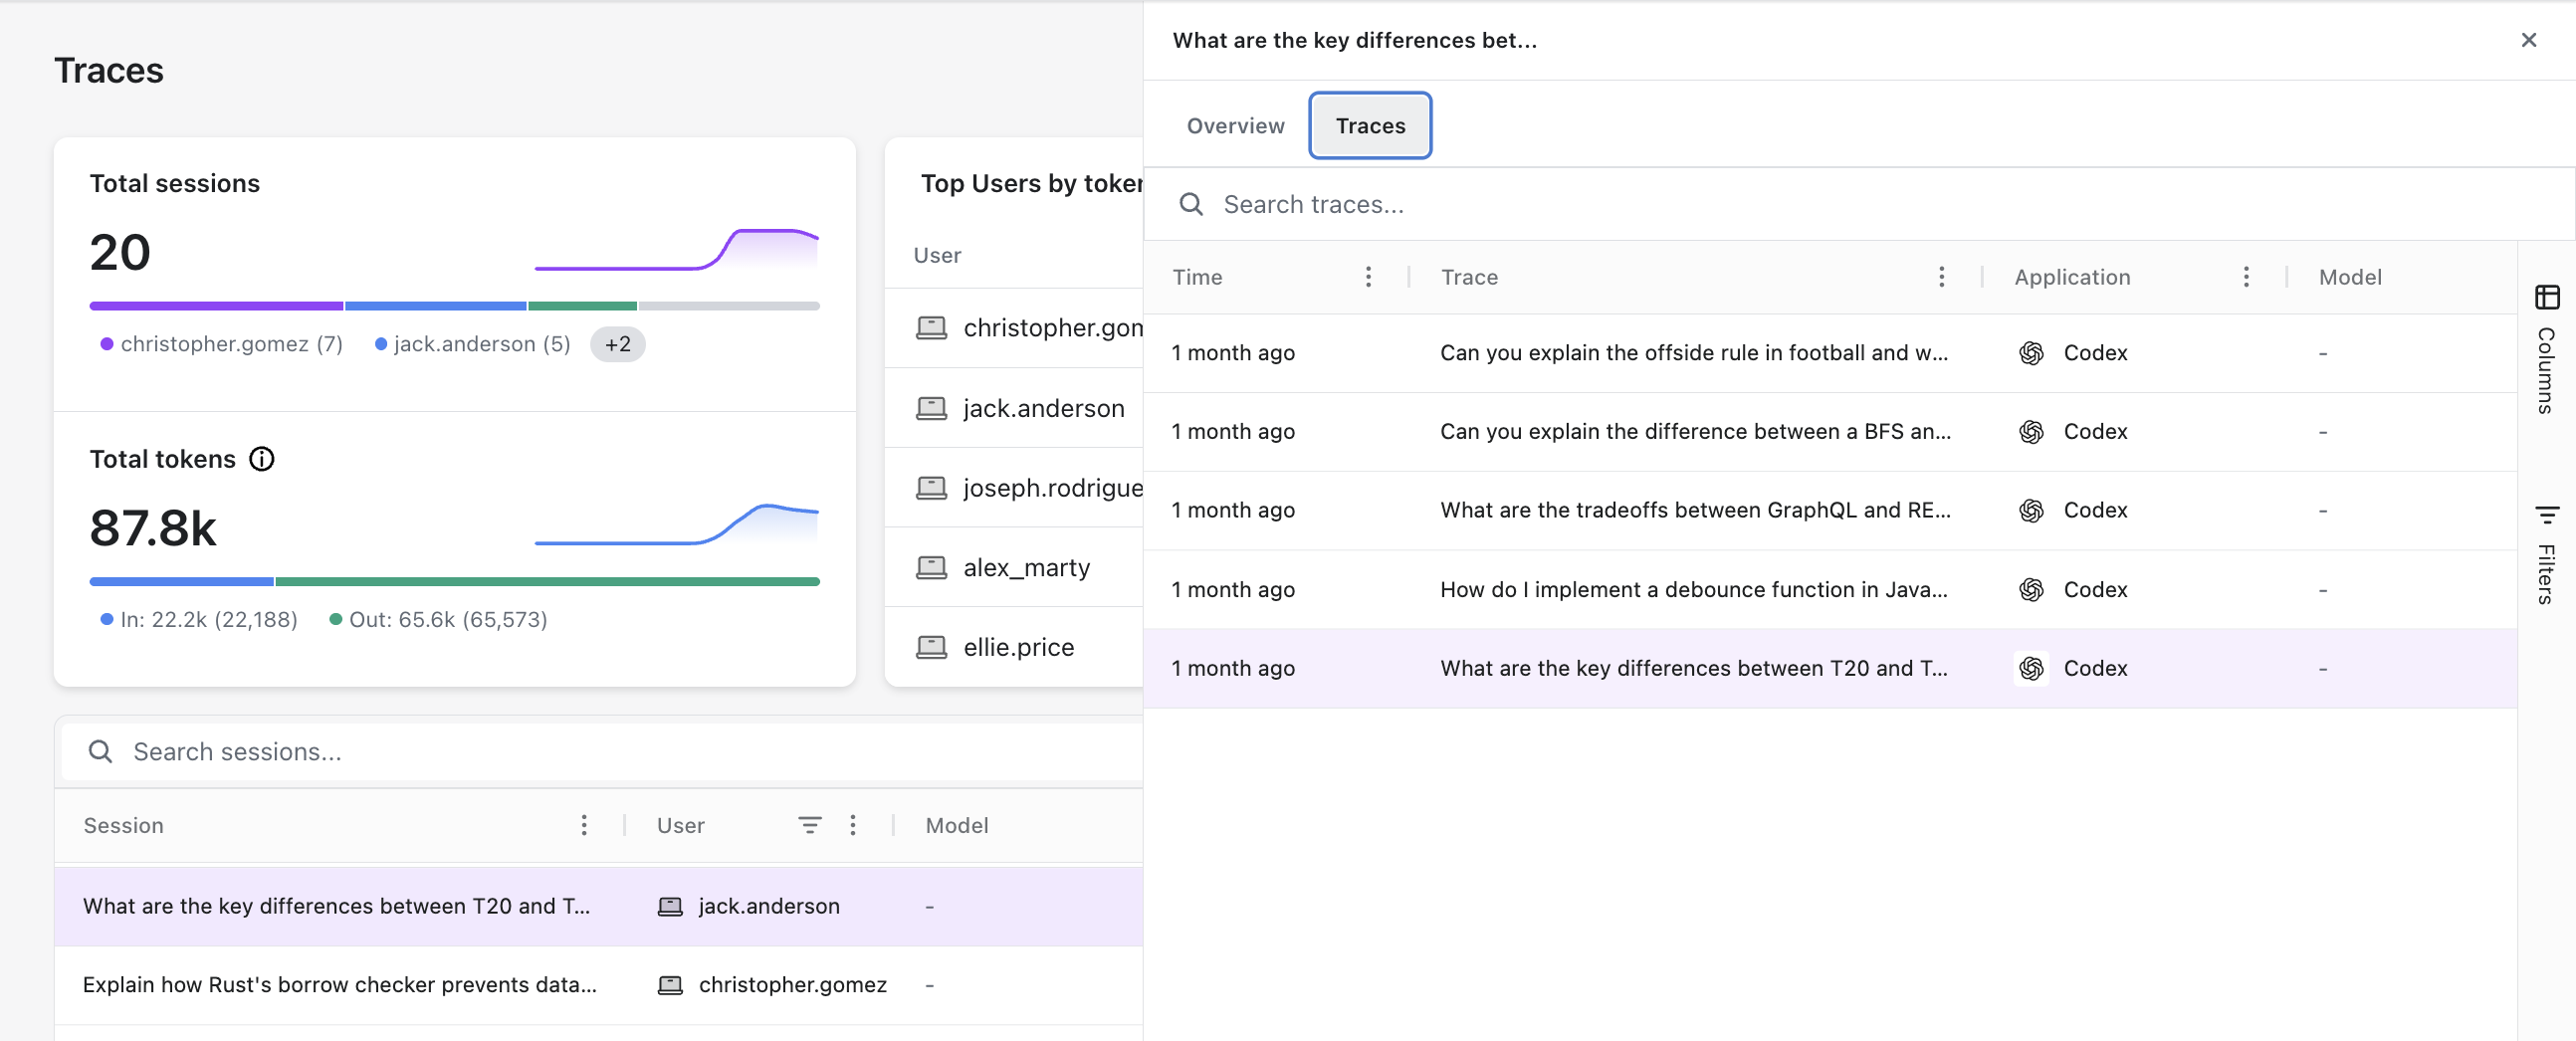
The Traces tab lists every individual trace recorded within the session, shown with its **Time**, a **Trace** preview, the **Application**, and the **Model** used.

Use **Search traces** to filter by keyword, and the **Columns** and **Filters** panels to customize the view.

<div data-with-frame="true"><figure><img src="/files/P6DKgWVuQYcWXWnPnFEB" alt="" width="563"><figcaption></figcaption></figure></div>
{% endtab %}
{% endtabs %}

## Trace Detail

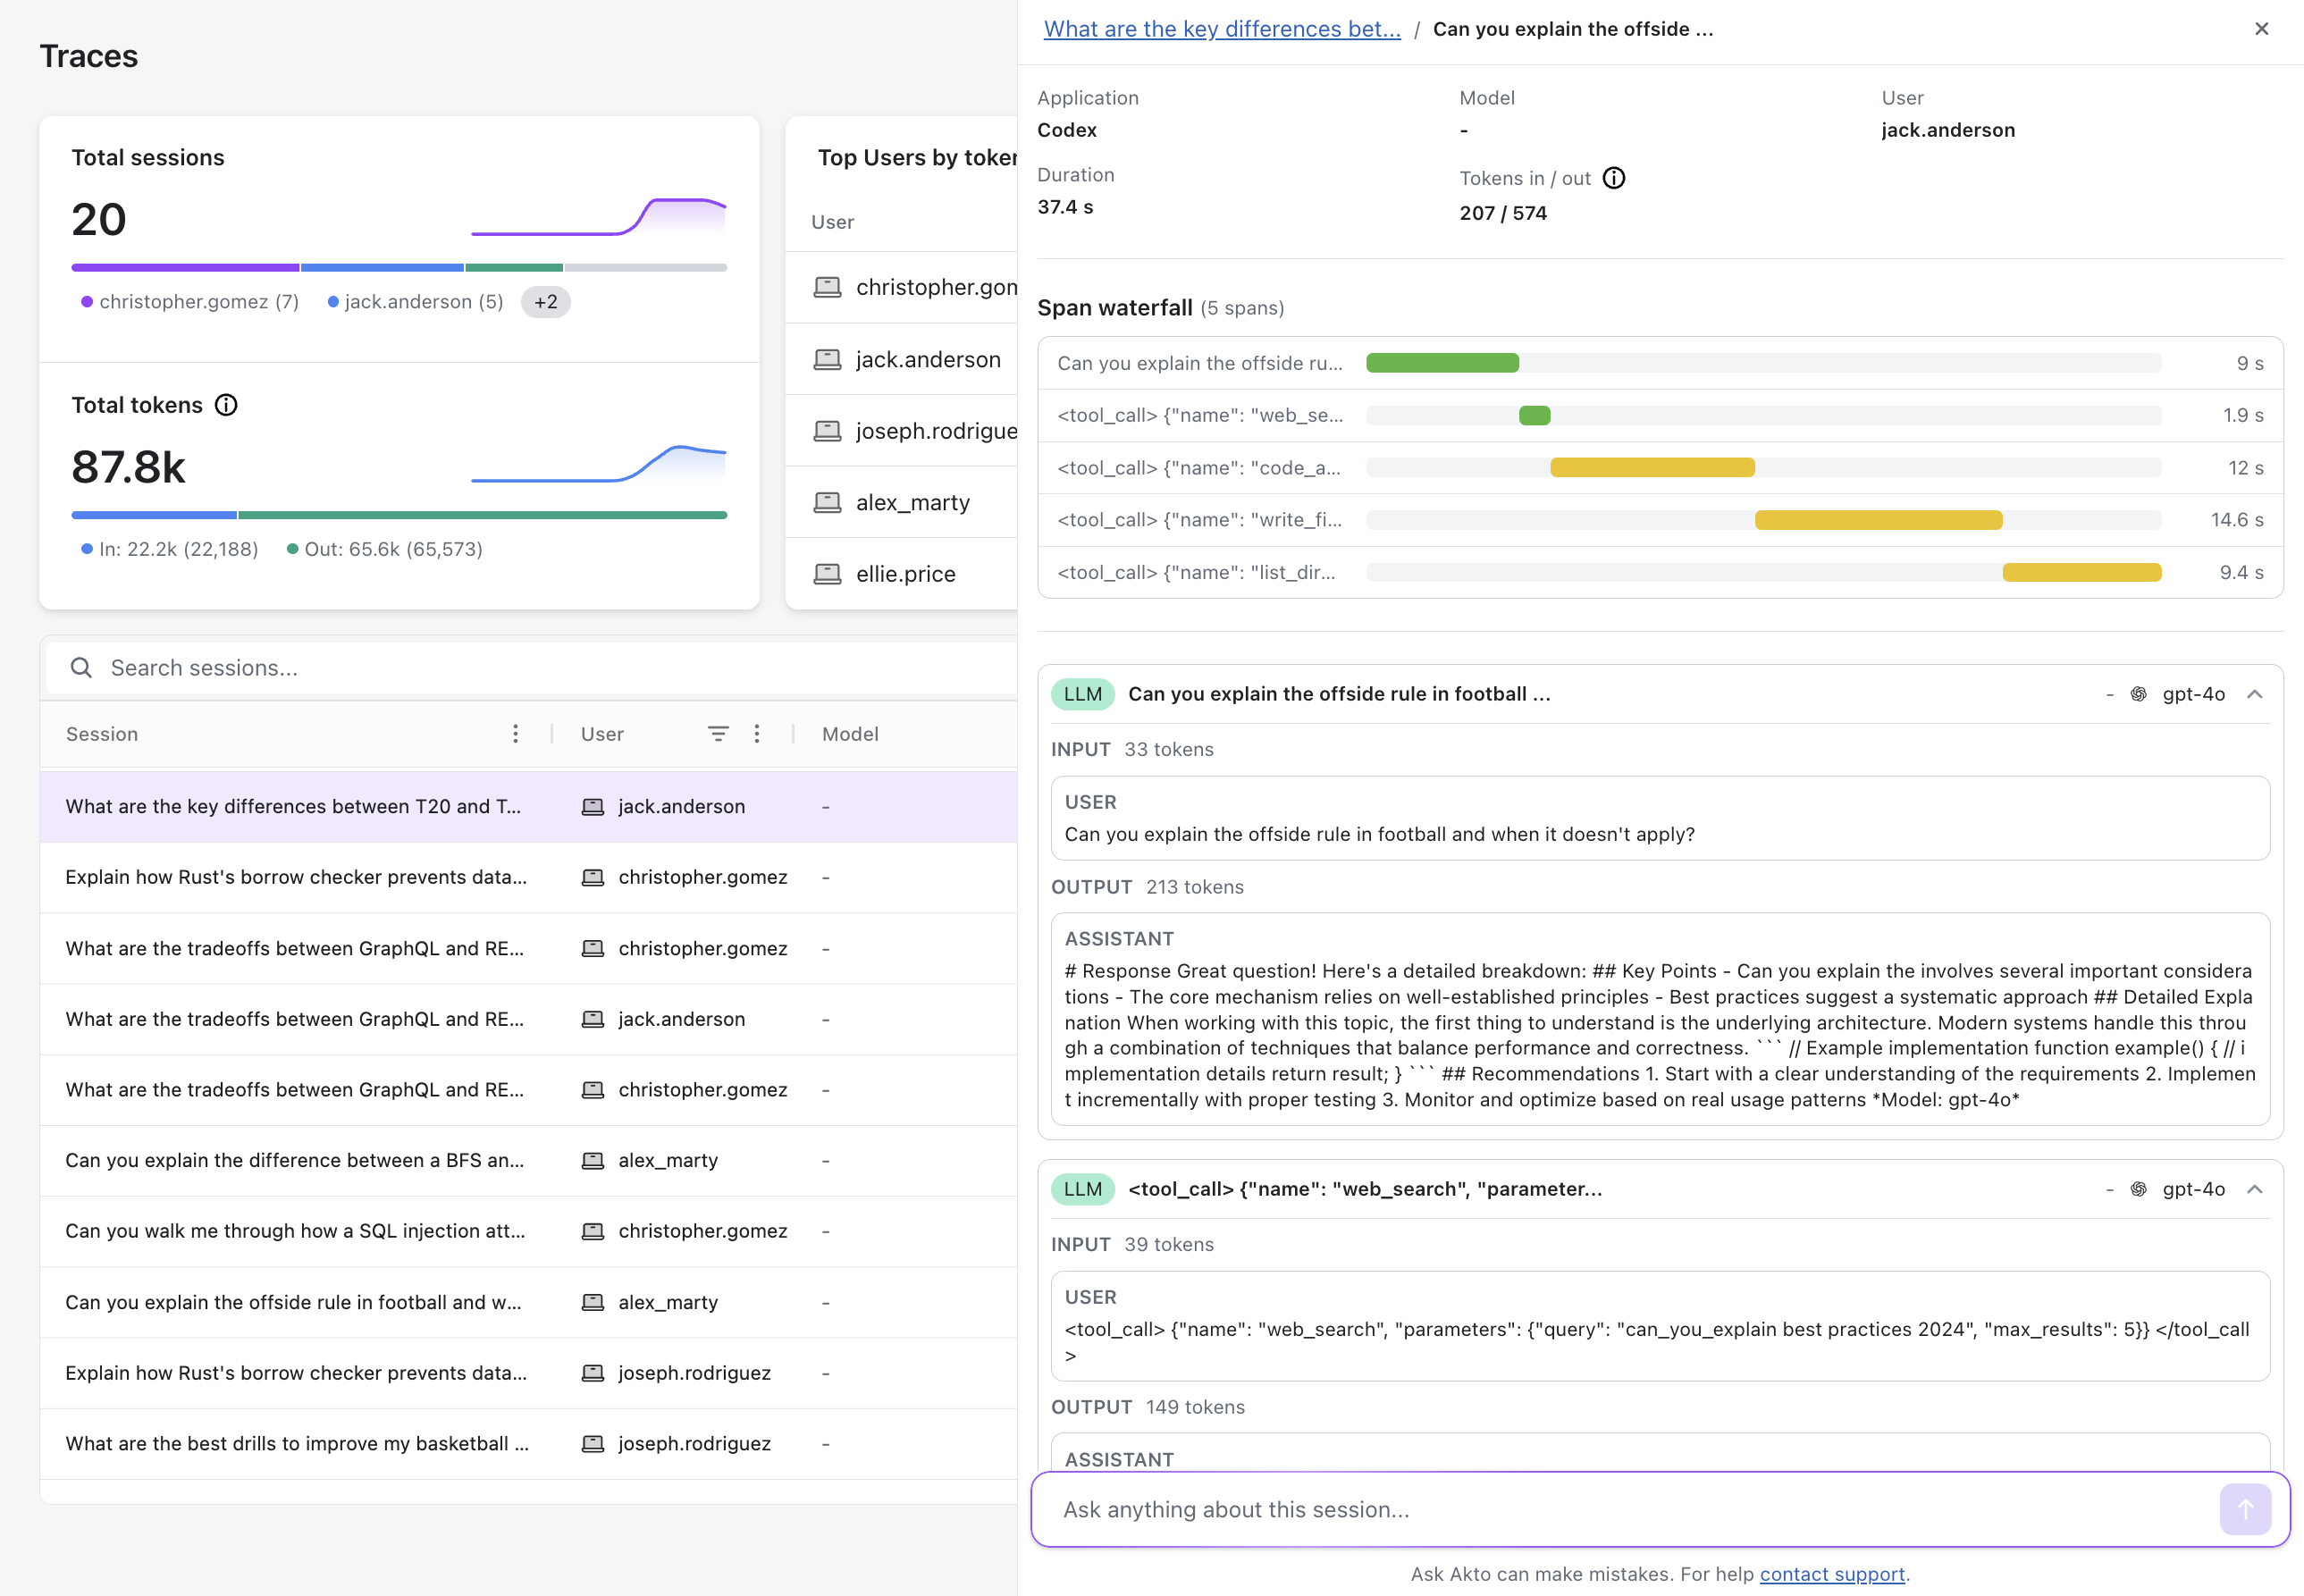
Click on a trace from the Traces tab to drill into that single request/response exchange.

The top of the trace detail shows the **Application**, **Model**, **User**, **Duration**, and **Tokens in / out** for that specific trace.

<div data-with-frame="true"><figure><img src="/files/KzIldfrPKJJMbHK8vxRq" alt="" width="563"><figcaption></figcaption></figure></div>

Below that, the **LLM** card shows the full exchange:

* **INPUT**: The complete prompt sent to the model, along with its token count
* **OUTPUT**: The model's response, along with its token count

{% hint style="info" %}
Use the breadcrumb at the top of the panel (e.g. session ID **/** trace ID) to navigate back to the parent session.
{% endhint %}