# Agent Architecture & Trace Analysis

## Overview

Agent Flow & Trace Analysis helps you visualise how components inside your agentic collection interact and execute during runtime.

Using architecture graphs and execution traces, you can understand:

* How requests flow through your system
* Which models, tools, and MCP servers are involved
* How agents interact during execution
* What happens during individual request runs

This gives you end-to-end visibility into your agentic workflows.

## Agent Architecture Flow

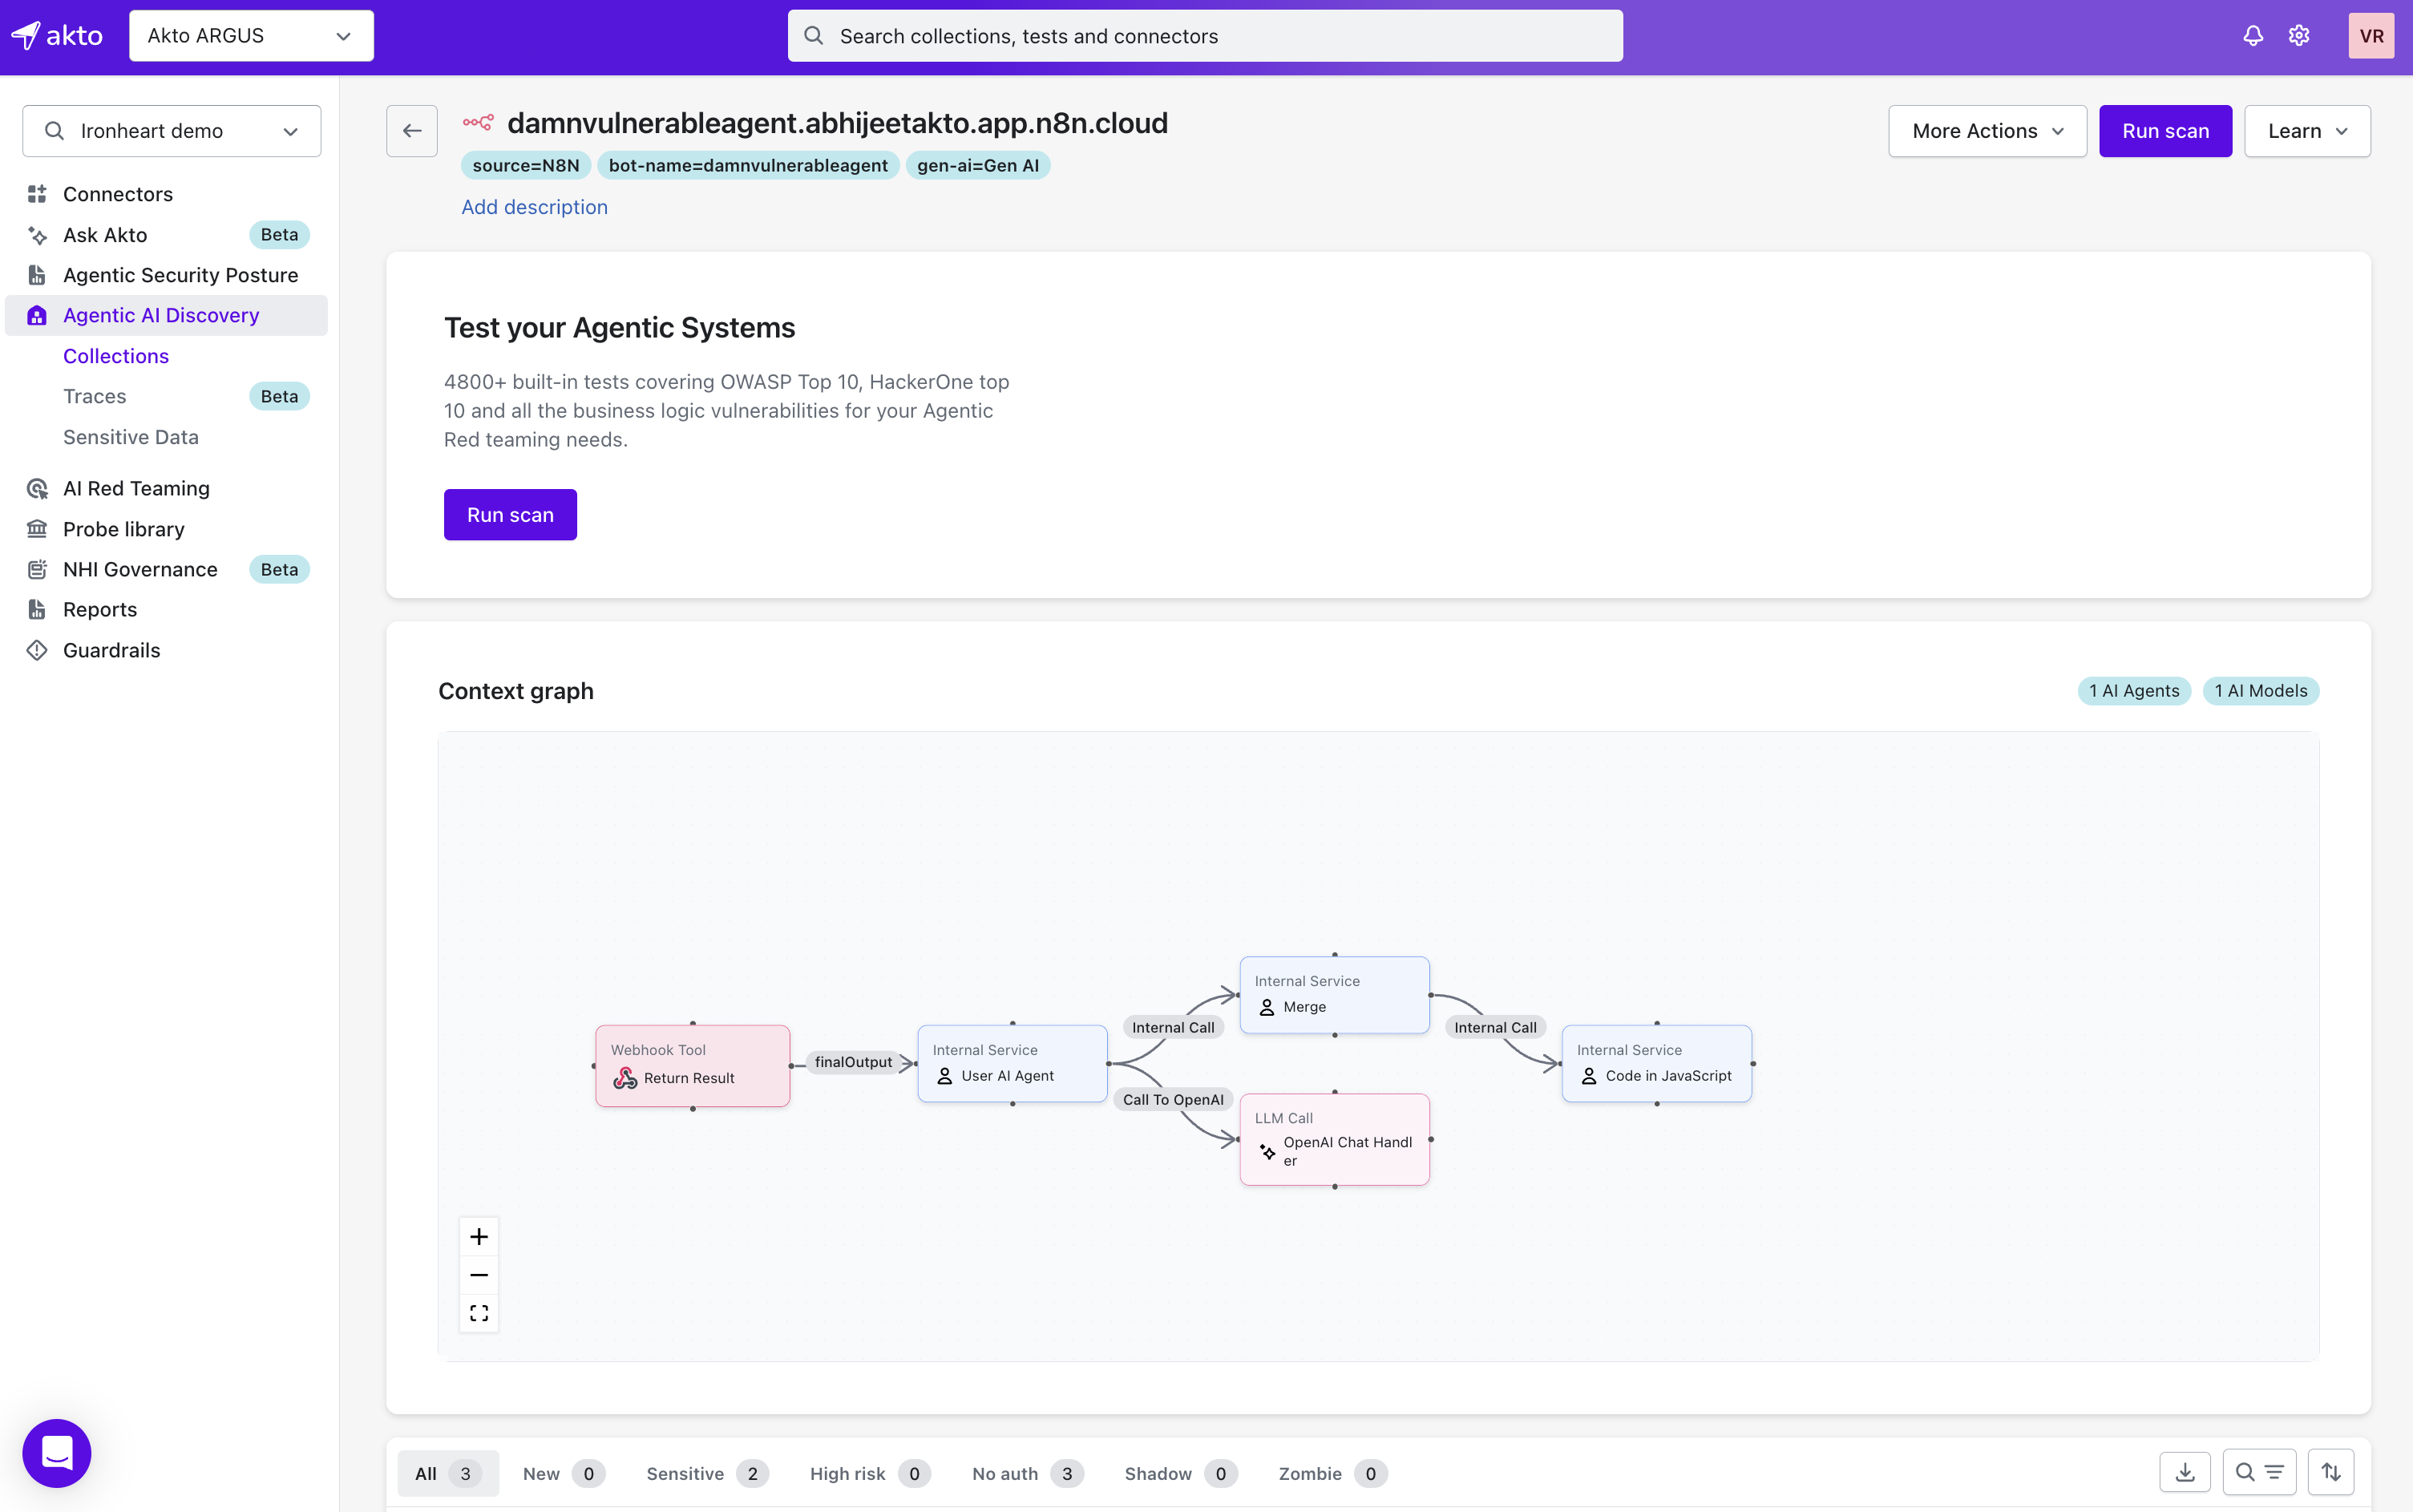
The Agent Flow graph provides a visual representation of your collection architecture and execution relationships between components.

It helps you understand how your agentic system is structured and how requests move across connected components.

<div data-with-frame="true"><figure><img src="/files/NFLHNY0VtXvhUz3hmZ3j" alt="" width="563"><figcaption></figcaption></figure></div>

### What You Can See

The graph includes all major components inside your collection, such as:

* AI Agents, LLMs, MCP Servers, Tools, Webhooks, External integrations

Each node represents a component, while edges represent execution or communication flow between components.

{% hint style="info" %}

## Why It Matters

Using the Agent Architecture graph, you can:

* Understand your orchestration architecture
* Identify dependencies between agents and tools
* Inspect model and MCP integrations
* Analyse request execution paths
* Validate workflow connectivity before running scans

{% endhint %}

### Component Relationships

The graph helps you visualise:

* Agent-to-model communication
* Tool invocation paths
* MCP server interactions
* Input and output routing
* Chained execution flows

## Trace Analysis

Trace Analysis helps you inspect how individual components executed during runtime.

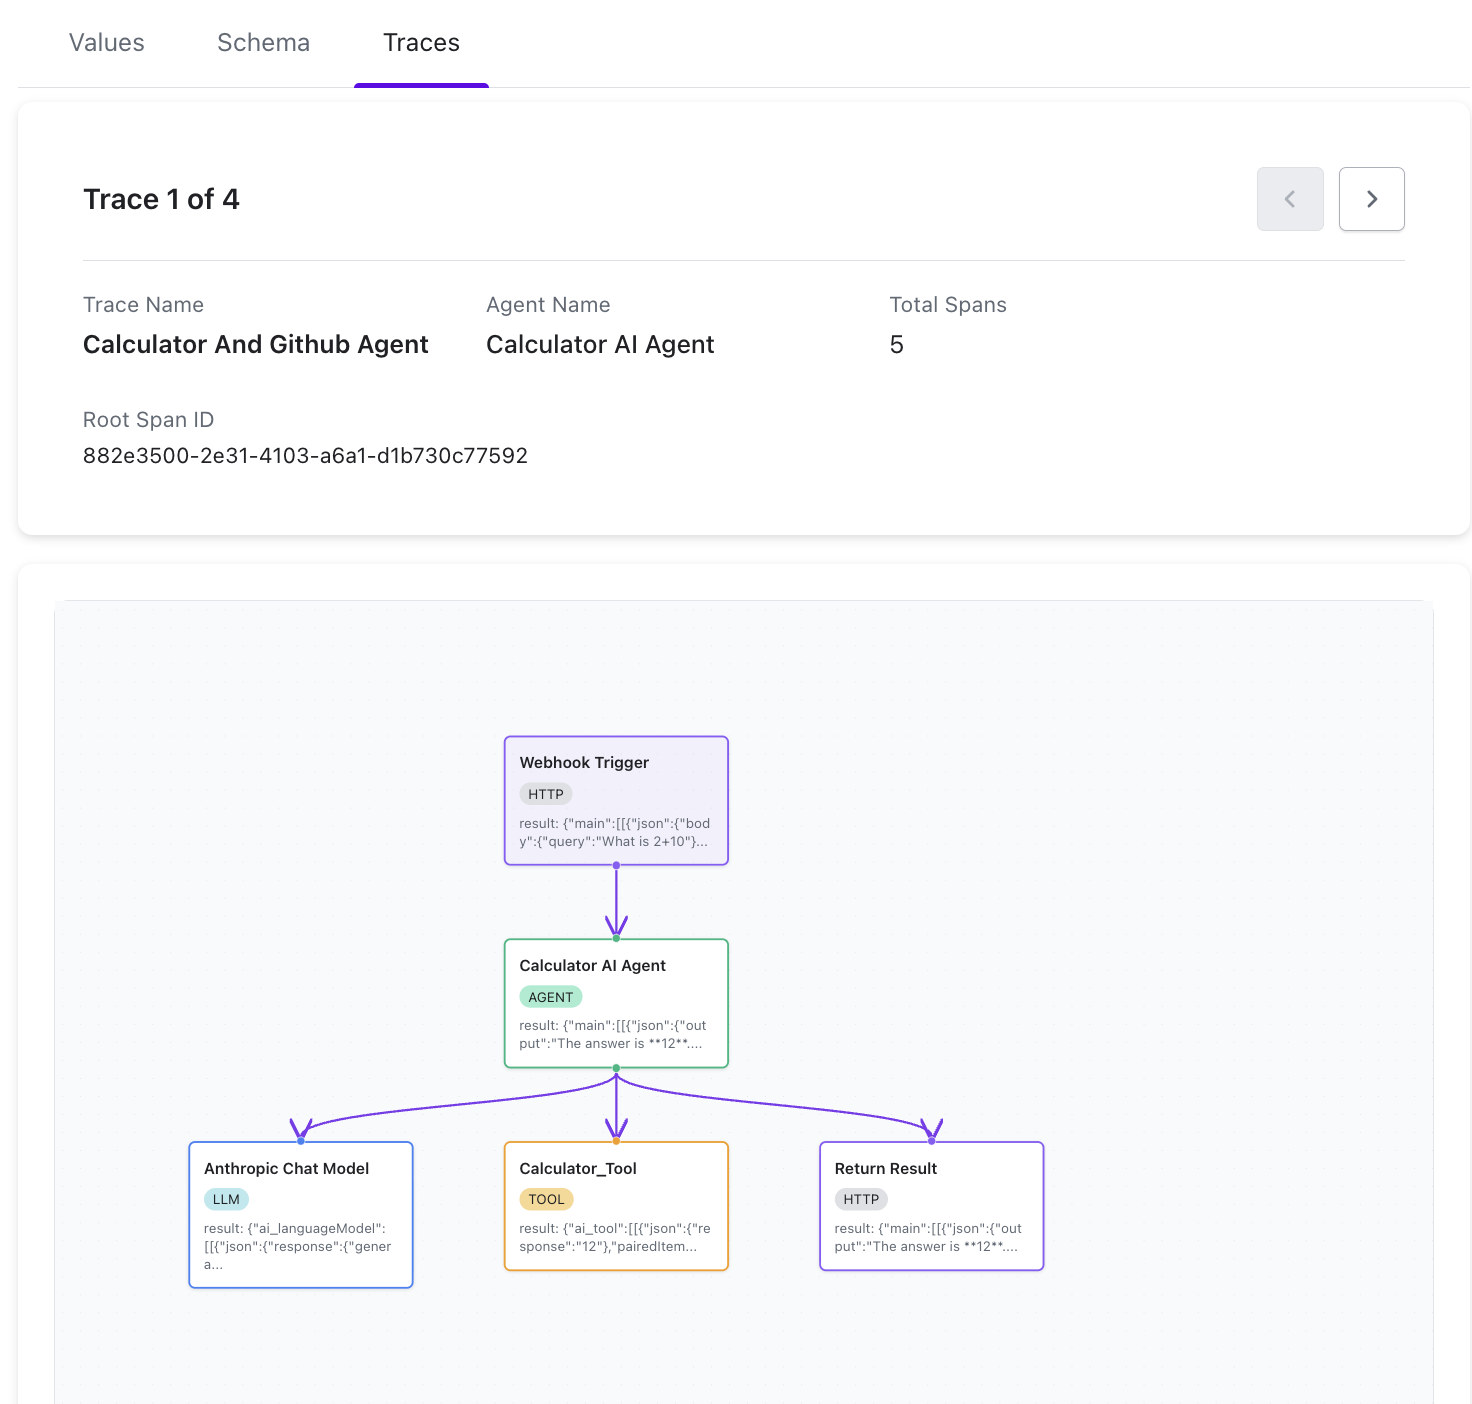
Each component can contain multiple traces, where every trace represents a separate execution instance triggered by a request.

<div data-with-frame="true"><figure><img src="/files/9Uqg2marZd9tvtD8jXnN" alt="" width="563"><figcaption></figcaption></figure></div>

### Trace Overview

For every component, Akto captures multiple execution traces generated from separate request runs.

Each trace contains:

<table><thead><tr><th width="196.80859375">Field</th><th>Description</th></tr></thead><tbody><tr><td>Trace Name</td><td>Identifier for the execution trace.</td></tr><tr><td>Agent Name</td><td>Agent associated with the execution run.</td></tr><tr><td>Root Span ID</td><td>Primary span identifier for the trace.</td></tr><tr><td>Total Spans</td><td>Total execution spans captured in the request lifecycle.</td></tr><tr><td>Execution Sequence</td><td>Ordered flow of component execution for the request.</td></tr><tr><td>Component Outputs</td><td>Runtime outputs generated at each execution stage.</td></tr></tbody></table>

You can navigate between traces to compare execution behavior across runs.

### Execution Graph

Each trace includes a visual execution graph that maps the complete request lifecycle for that execution run.

The graph helps you inspect:

* Trigger source
* Agent execution
* LLM calls
* Tool invocations
* Response generation

Each node contains the runtime output associated with that stage.

{% hint style="info" %}

## Why Trace Analysis Matters

Using traces, you can:

* Debug agent workflows faster
* Compare behavior across executions
* Validate tool responses
* Verify LLM interactions
* Investigate orchestration failures
* Analyze runtime execution end-to-end

{% endhint %}

## Common Use Cases

1. **Debug Agent Execution**\
   Inspect how an agent processed a request and which tools were invoked during a specific run.
2. **Compare Multiple Traces**\
   Analyse behavioural differences across multiple executions for the same component.
3. **Validate Tool Responses**\
   Verify whether connected tools returned expected outputs.
4. **Analyse Model Interactions**\
   Review model-generated responses and downstream execution behavior.
5. **Troubleshoot Failures**

   Identify where execution failed across spans or connected components.


---

# Agent Instructions: Querying This Documentation

If you need additional information that is not directly available in this page, you can query the documentation dynamically by asking a question.

Perform an HTTP GET request on the current page URL with the `ask` query parameter:

```
GET https://ai-security-docs.akto.io/akto-argus-agentic-ai-security-for-homegrown-ai/agentic-ai-discovery/concepts/agent-architecture-and-trace-analysis.md?ask=<question>
```

The question should be specific, self-contained, and written in natural language.
The response will contain a direct answer to the question and relevant excerpts and sources from the documentation.

Use this mechanism when the answer is not explicitly present in the current page, you need clarification or additional context, or you want to retrieve related documentation sections.
