> For the complete documentation index, see [llms.txt](https://ai-security-docs.akto.io/llms.txt). Markdown versions of documentation pages are available by appending `.md` to page URLs; this page is available as [Markdown](https://ai-security-docs.akto.io/agentic-guardrails/concepts/threat-dashboard.md).

# Threat Dashboard

## Overview

The Guardrails dashboard, titled **Guardrail Violations Detected** in the app, provides a centralised view of security threats detected across **AI agents, prompts, and tool invocations**. It focuses on **runtime agentic security risks**, including prompt injection, unauthorised tool access, sensitive data leakage, and malicious agent behaviour.

## Guardrail States and Lifecycle

The main table lists all detected agentic security threats. Each row represents a consolidated security finding derived from one or more prompts, tool calls, or agent executions.

Guardrails are organized into the following operational states:

* **Active**\
  Guardrails that require investigation or remediation.
* **Under Review**\
  Guardrails currently being analyzed or validated.
* **Ignored**\
  Guardrails marked as non-actionable for the environment.

This lifecycle enables structured triage while preserving full execution context.

## Guardrail Attributes Displayed

Each guardrail entry includes the following attributes:

<table><thead><tr><th width="193.6640625">Attribute</th><th>Description</th></tr></thead><tbody><tr><td><strong>Severity</strong></td><td>Represents the risk level of the agentic guardrail based on exploitability and potential security impact.</td></tr><tr><td><strong>Guardrail Name</strong></td><td>Identifies the detected agentic security issue, such as prompt injection, excessive sensitive data exposure, or unauthorized tool access.</td></tr><tr><td><strong>Detection Type</strong></td><td>Indicates the detection category used to identify the violation, such as single-prompt analysis or tool invocation analysis.</td></tr><tr><td><strong>Number of Endpoints</strong></td><td>Indicates the count of agent-accessible endpoints or tools affected by the violation.</td></tr><tr><td><strong>Domains</strong></td><td>Lists the domains or agent platforms where the guardrail activity was observed.</td></tr><tr><td><strong>Compliance Mapping</strong></td><td>Shows the governance and compliance frameworks impacted by the detected agent behavior.</td></tr><tr><td><strong>Discovered</strong></td><td>Displays the timestamp when Akto first detected the violation.</td></tr></tbody></table>

## Compliance-Based Guardrail Filtering

#### Compliance Framework Selector

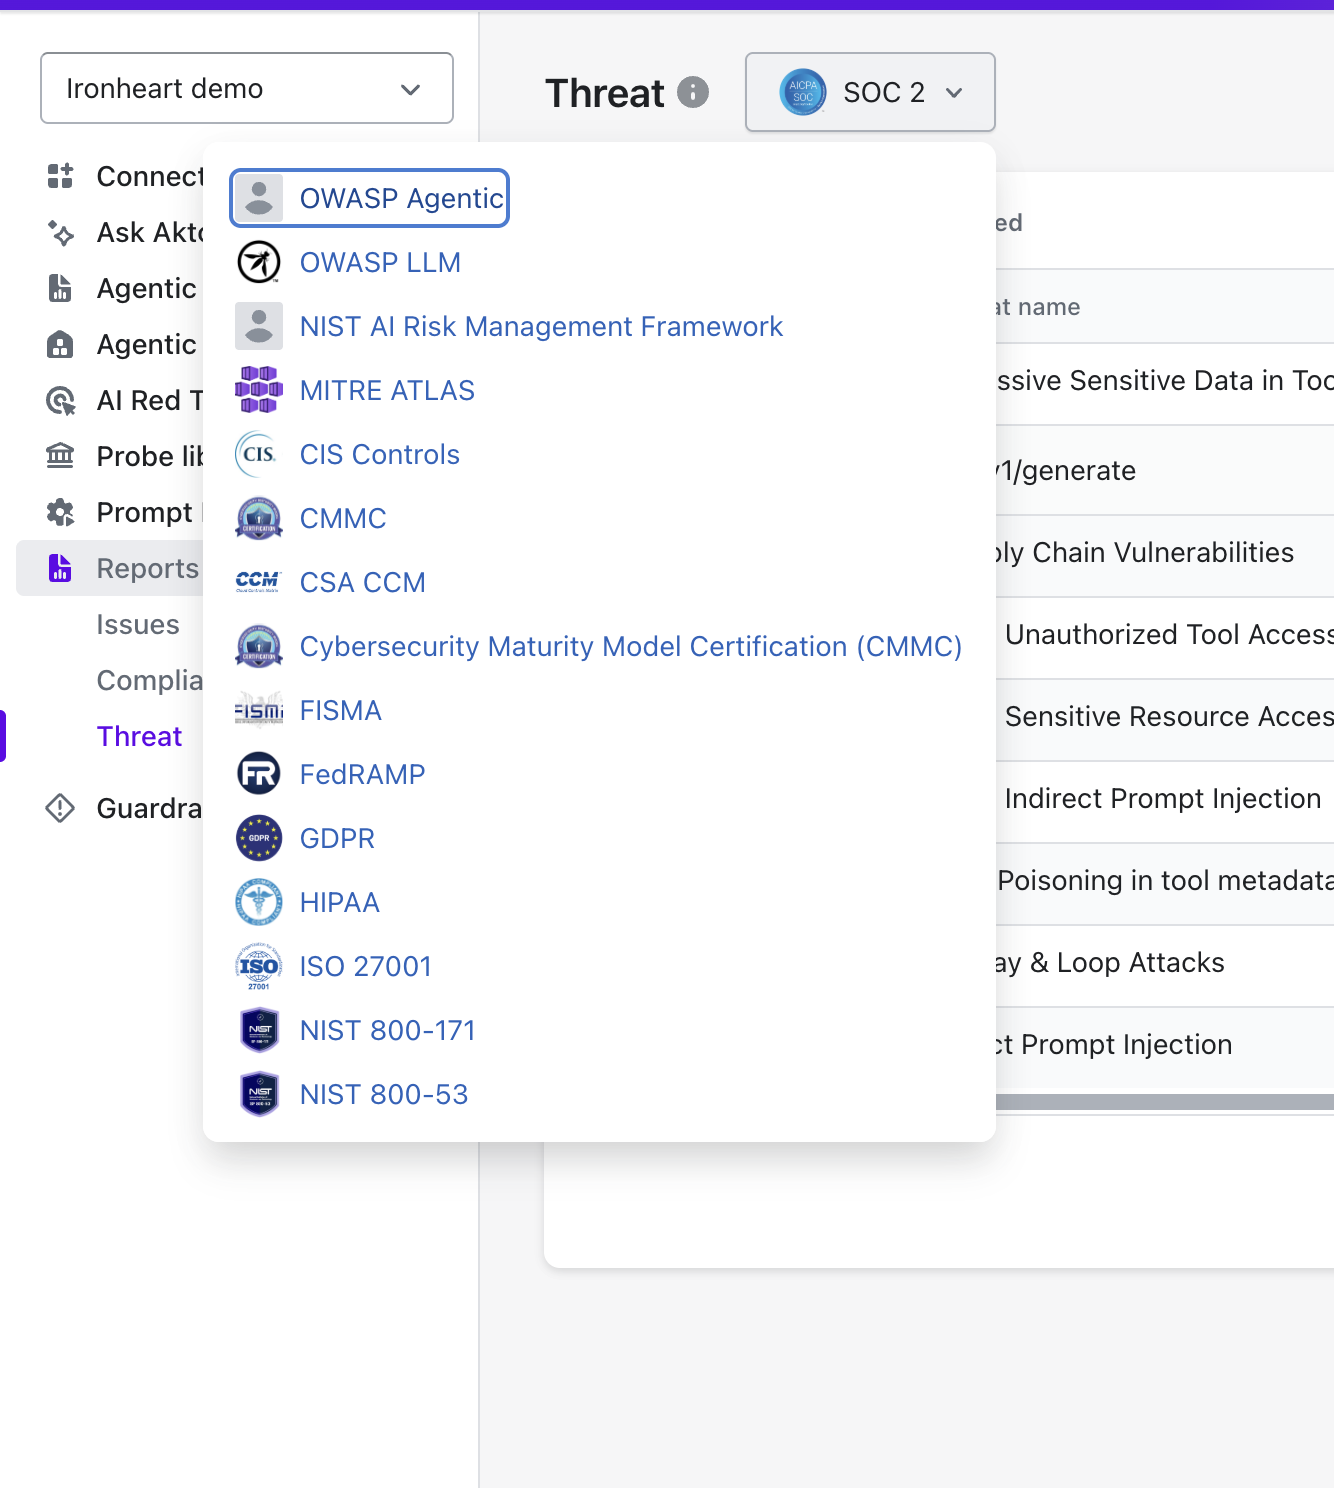
The Guardrails dashboard allows filtering agentic threats by compliance framework to support governance and audit workflows.

<figure><img src="https://3128331180-files.gitbook.io/~/files/v0/b/gitbook-x-prod.appspot.com/o/spaces%2Ftog5ODwYfqPOf4eQhsOC%2Fuploads%2Fgit-blob-cd7d619d60f6efc83a7d40bc7c1680496bd7945b%2Fimage.png?alt=media" alt="" width="375"><figcaption></figcaption></figure>

Supported frameworks include:

* OWASP Agentic Skills Top 10
* OWASP Agentic Top 10
* OWASP LLM
* OWASP
* EU AI Act
* NIST AI Risk Management Framework
* NIST 800-53
* NIST 800-171
* CIS Controls
* CSA CCM
* Cybersecurity Maturity Model Certification (CMMC)
* FISMA
* FedRAMP
* GDPR
* HIPAA
* ISO 27001
* PCI DSS
* SOC 2
* MITRE ATLAS

This filter helps you focus on agent behaviours that directly impact regulatory and internal security requirements.

## Time Range and Exporting

* **Export Threat Report** (top right corner): generates a report of the threats currently shown on the dashboard, scoped to your applied time range. The report's content varies depending on which compliance framework you have selected.
* **Time range selector** (next to it, e.g. **Last 7 days**): scopes the whole page, the guardrail table, and the compliance framework view, to that window.

## Navigating to Guardrail Activity Details

From the Guardrails dashboard, you can navigate to detailed guardrail activity views for request- and prompt-level investigation.

Selecting a guardrail from the Guardrails dashboard opens the **Guardrail Activity Detailed View**, which provides execution-level visibility into how the guardrail was detected.

From the detailed view, you can analyse:

* Prompts associated with the guardrail
* Tool invocations triggered by the agent
* Sensitive data accessed or exposed
* Guardrails violated during execution
* Repeated or anomalous agent behaviour patterns

Detailed documentation for this investigation flow is available at:

[👉 **Guardrail Activity Detailed View**](/agentic-guardrails/how-to/guardrail-activity-detailed-view.md)